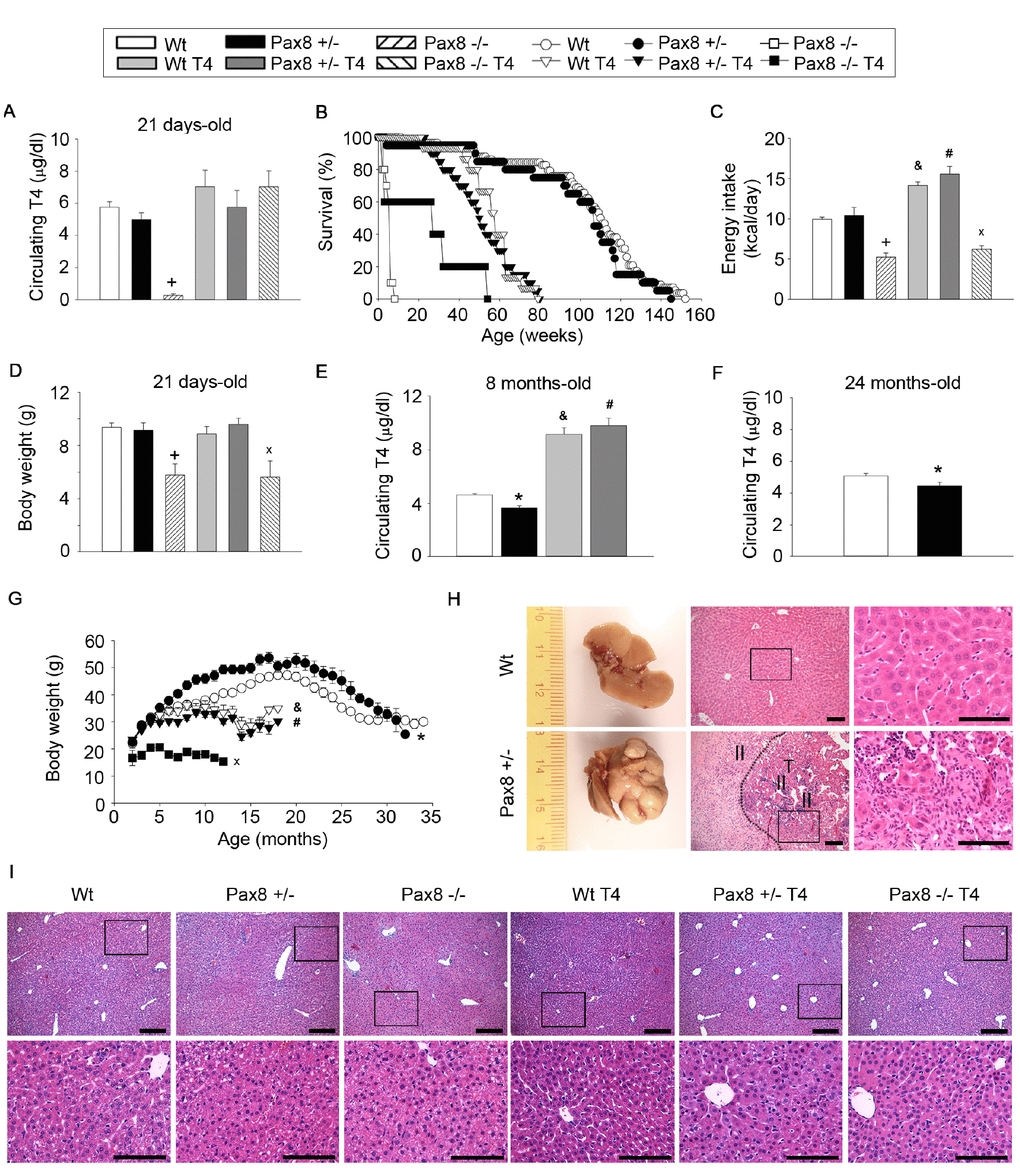
Figure 1.High or low TH levels compromise murine healthspan and lifespan. (A) Circulating T4 levels at 21 days of age. n = 5 Wt, n = 5 Pax8 +/-, n = 5 Pax8 -/-, n = 5 Wt T4, n = 5 Pax8 +/- T4, n = 3 Pax8 -/- T4. Two-way ANOVA. (B) Kaplan-Meier survival curve. n = 58 Wt, n = 20 Pax8 +/-, n = 10 Pax8 -/-, n = 15 Wt T4, n = 20 Pax8 +/- T4, n = 5 Pax8 -/- T4. Survival log rank test. (C) Basal daily energy intake in 5-weeks old mice. n = 5 Wt, n = 4 Pax8 +/-, n = 3 Pax8 -/-, n= 3 Wt T4, n = 3 Pax8 +/- T4, n = 3 Pax8 -/- T4 (the “n” reflects the number of cages). Two-way ANOVA. (D) Body weight at 21 days of age. n = 21 Wt, n = 15 Pax8 +/-, n = 5 Pax8 -/-, n = 11 Wt T4, n = 11 Pax8 +/- T4, n = 4 Pax8 -/- T4. Two-way ANOVA. (E) Circulating T4 levels at 8 months of age. n = 11 Wt, n = 5 Pax8 +/-, n = 7 Wt T4, n = 5 Pax8 +/- T4. Two-way ANOVA. (F) Circulating T4 levels at 24 months of age. n = 8 per group. T-test two tailed. (G) Body weight during longevity assay. n = all available mice of longevity assay (panel B). One-way ANOVA or ANOVA on ranks if distribution is not normal. * on months 6-17 and 21-28. & on months 12-18. # on months 3, 5-8 and 10-18. x on months 3-12. (H) Representative photographs and hematoxylin and eosin staining of liver tissue from Wt and Pax8 +/- mice at necropsies. Wt liver exhibits normal hepatic parenchyma with acinar architecture. Pax8 +/- liver displays primary liver epithelial neoplasms (T) with disorganized architecture and inflammatory infiltrate (II). Scale bar 100 um. n = 4 per group. See also Supplementary Figure 1K. (I) Histological analysis of liver tissue by hematoxylin and eosin staining at 21 days of age. n = 4 Wt, n = 5 Pax8 +/-, n = 5 Pax8 -/-, n = 5 Wt T4, n = 5 Pax8 +/- T4, n = 3 Pax8 -/- T4. Scale bars; top: 200 μm; down: 100 μm. Data are represented as the mean ± SEM. * p-value < 0.05 between Wt mice and Pax8 +/- mice. + p-value < 0.05 between Wt mice and Pax8 -/- mice. & p-value < 0.05 between Wt mice and Wt T4 mice. # p-value < 0.05 between Wt mice and Pax8 +/- T4 mice. x p-value < 0.05 between Wt mice and Pax8 -/- T4.