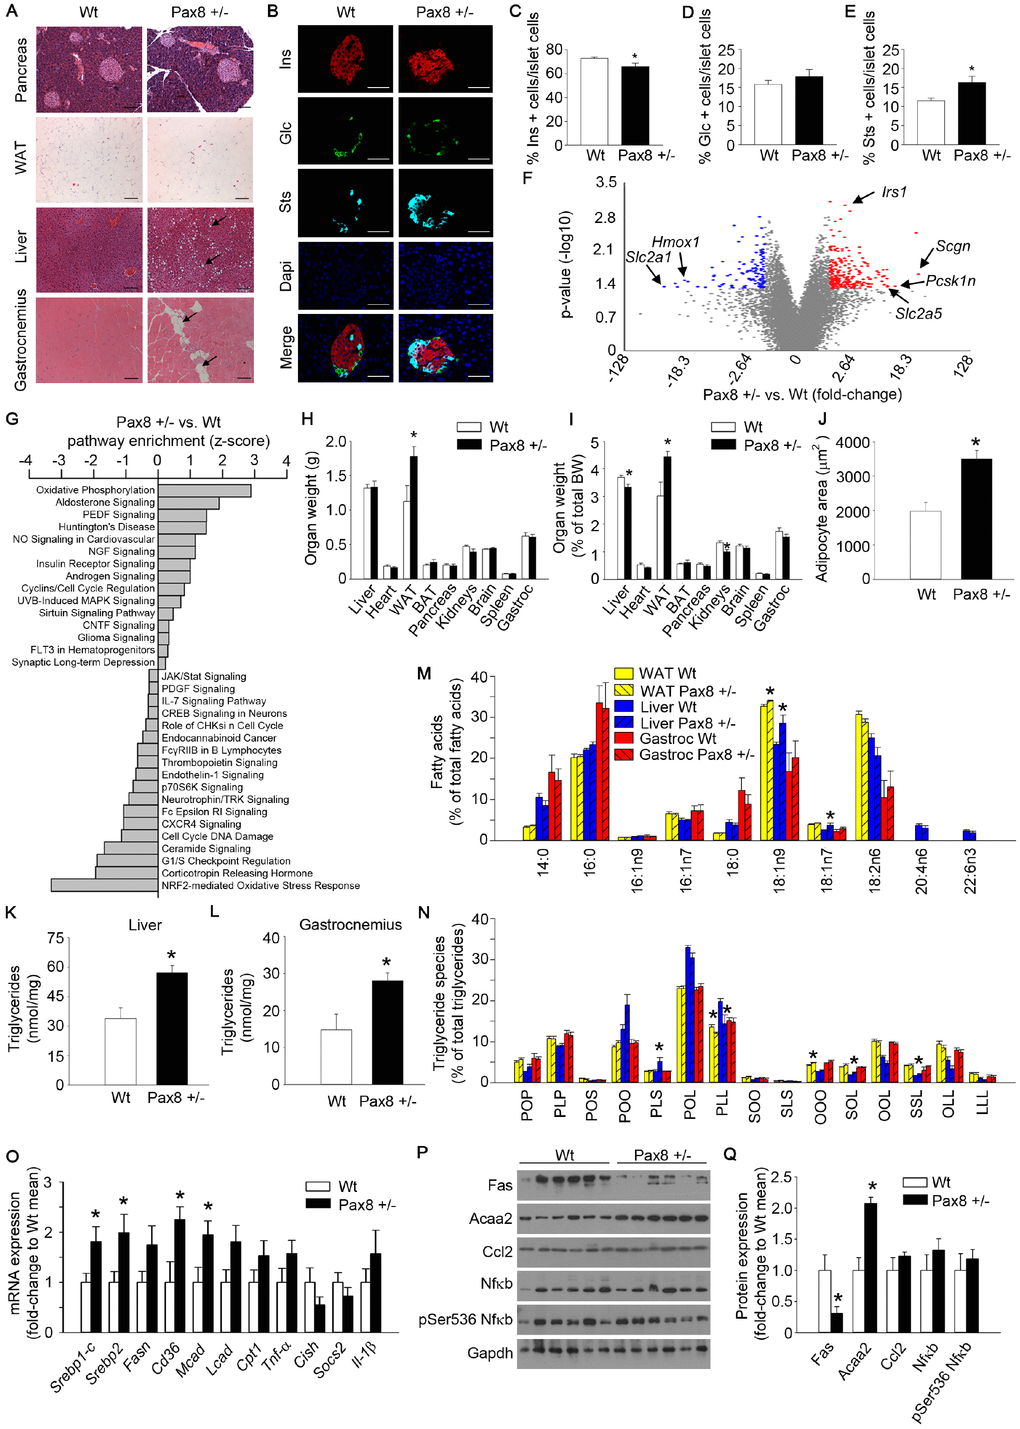
Figure 5.Mild hypothyroid Pax8 +/- mice accumulate ectopic lipid depositions. (A) Representative images of hematoxylin and eosin staining of WAT, gastrocnemius, pancreas and liver of Wt and Pax8 +/- mice. Arrows indicate adipocyte infiltrations in gastrocnemius and lipid droplets in liver tissue. WAT: n = 6 Wt, n = 4 Pax8 +/-; gastrocnemius: n = 6 per group; pancreas: n = 3 per group; liver: n = 6 per group; Scale bar = 100 μm. (B) Representative immunofluorescence images of pancreatic sections from untreated Wt and Pax8 +/- male mice at 9 months of age. Scale bar: 50 μm. Ins: insulin. Glc: glucagon. Sts: somatostatin. n = 5 Wt, n = 4 Pax8 +/-. (C) Percentage of insulin positive cells in islet cells at 9 months of age. n = 5 Wt, n = 4 Pax8 +/-. T-test two tailed. (D) Percentage of glucagon positive cells in islet cells at 9 months of age. n = 5 Wt, n = 4 Pax8 +/-. T-test two tailed. (E) Percentage of somatostatin positive cells in islet cells at 9 months of age. n = 5 Wt, n = 4 Pax8 +/-. T-test two tailed. (F) Volcano plot showing the fold change and statistical significance of genes expressed in pancreatic islets. Statistical analysis was performed using Transcription Analysis Console using default parameters. Arrows indicate specific dots of highlighted genes. See also Supplementary Figure 5E–5G. n = 3 per group. (G) Analysis of significantly modulated annotated canonical pathways in pancreatic islets using Ingenuity Pathway Analysis platform. Statistical analysis was performed using Ingenuity Pathway Analysis using significantly modulated genes. n = 3 per group. (H) Tissues weight. n = 6 per group. T-test two tailed. (I) Tissues weight corrected by total body weight. n = 6 per group. T-test two tailed. (J) Quantification of adipocyte area. n = 6 Wt, n = 4 Pax8 +/-. T-test two tailed. (K) Triglyceride content per mg of protein in liver. n = 6 Wt, n = 4 Pax8 +/-. T-test two tailed. (L) Triglyceride content per mg of protein in gastrocnemius. n = 5 Wt, n = 4 Pax8 +/-. T-test two tailed. (M) Lipidomic analysis depicting percentages of the different species of fatty acids in WAT, liver and gastrocnemius. n = 5 Wt, n = 6 Pax8 +/-. Two-way ANOVA. See also Supplementary Figure 5H. (N) Lipidomic analysis depicting percentages of triglyceride species in WAT, liver and gastrocnemius. P: Palmitic acid. O: Oleic acid. L: Linoleic acid. S: Stearic acid. n = 5 Wt, n = 6 Pax8 +/-. Two-way ANOVA. (O) mRNA expression of genes involved in lipid synthesis/import and inflammation in livers from Wt and Pax8 +/- mice. Srebp1-c: n = 6 per group. Srebp2: n = 6 per group. Fasn: n = 5 Wt, n = 6 Pax8 +/-. Cd36: n = 6 Wt, n = 5 Pax8 +/-. Mcad: n = 6 per group. Lcad: n = 6 per group. Cpt1: n = 6 per group. Tnf-α: n = 5 Wt, n = 6 Pax8 +/-. Cish: n = 4 Wt, n = 5 Pax8 +/-. Socs2: n = 4 Wt, n = 4 Pax8 +/-. Il-1β: n = 6 per group. T-test two tailed. (P) Western blots showing protein expression levels of markers of lipid metabolism and inflammation in liver lysates. n = 6 per group. (Q) Densitometric analysis of western blots shown in panel P. n = 6 per group. T-test two tailed. Data are represented as the mean ± SEM. Mice were 9 month-old at the time of killing. vs: versus. * p-value < 0.05.