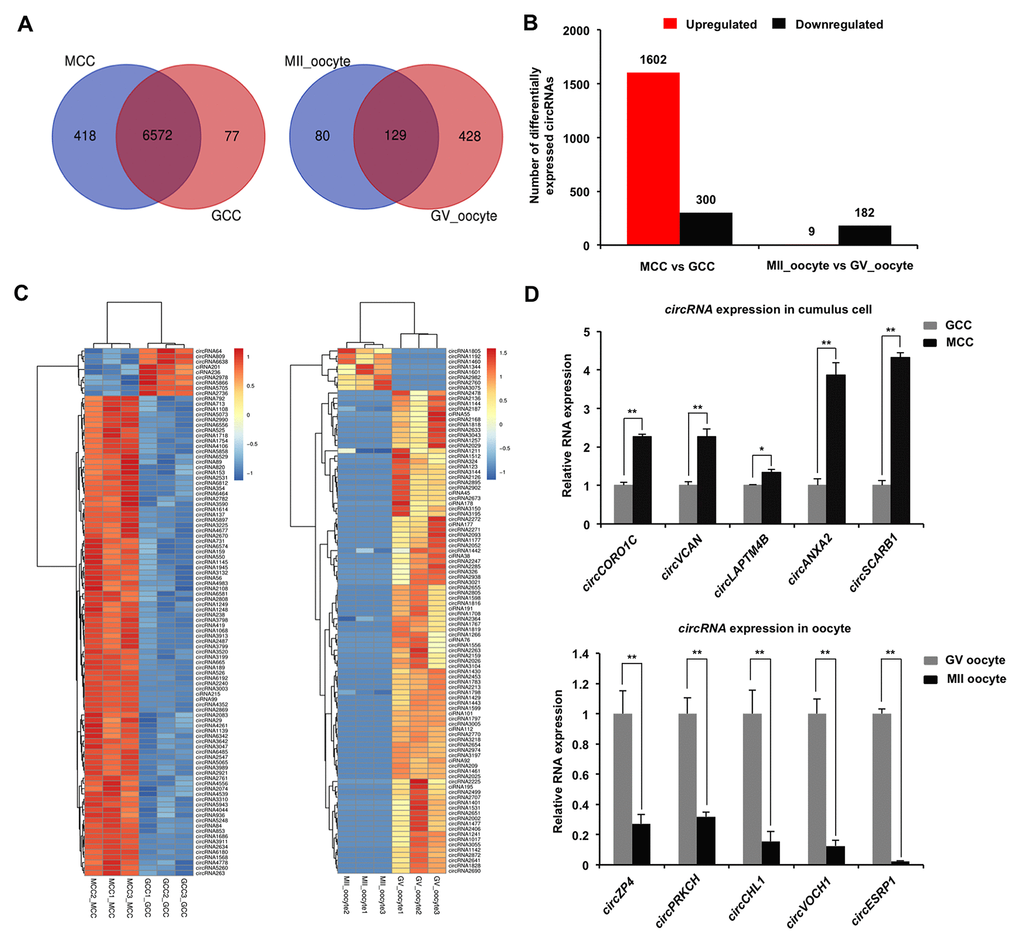
Figure 2.Identification and validation of differentially expressed circRNAs (DECs) in both cumulus cells and oocytes during meiotic maturation. (A) Venn diagram of circRNAs identified in cumulus cells or oocytes. Cumulus cells and oocytes before and after meiotic maturation were pooled for RNA-seq. Expression levels of circRNAs in cumulus cells (left panel) and oocytes (right panel) were analyzed by means of a binominal statistical test. Overlapping circles present circRNAs that are common for cumulus cells or oocytes between two different stages. Non-overlapping circles indicate circRNAs that are specific for cumulus cells or oocytes before (pink) and after (blue) meiotic maturation. (B) The number of differentially expressed circRNAs in cumulus cells or oocytes before and after meiotic maturation. The results were considered statistically significant at Padjusted< 0.05 and log2 fold change ≥1. Red bars indicate up-regulated circRNAs; black bars denote down-regulated circRNAs. (C) Heatmap illustrating the expression patterns of differentially expressed circRNAs in cumulus cells (left panel) or oocytes (right panel) before and after meiotic maturation. The red blocks represent up-regulated circRNAs, and the blue blocks represent down-regulated circRNAs. The color scale of the heatmap indicates the expression level, where the brightest blue stands for -1.0 log2 fold change and the brightest red stands for 1.0 or 1.5 log2 fold change. (D) Validation of the selected differentially expressed circRNAs identified in both cumulus cells and oocytes. The several selected circRNAs were chosen from top up and top down-regulated circRNAs in cumulus cells or oocytes. Relative abundance of circRNAs in cumulus cells (upper panel) and oocytes (bottom panel) was determined by qPCR. The data were normalized against endogenous housekeeping gene EF1α1, and the value for cumulus cells or oocytes at GV stage was set as one. The data are shown as mean ± S.E.M. Statistical analysis was performed using t-student test. Values with asterisks vary significantly, *P < 0.05, **P < 0.01.