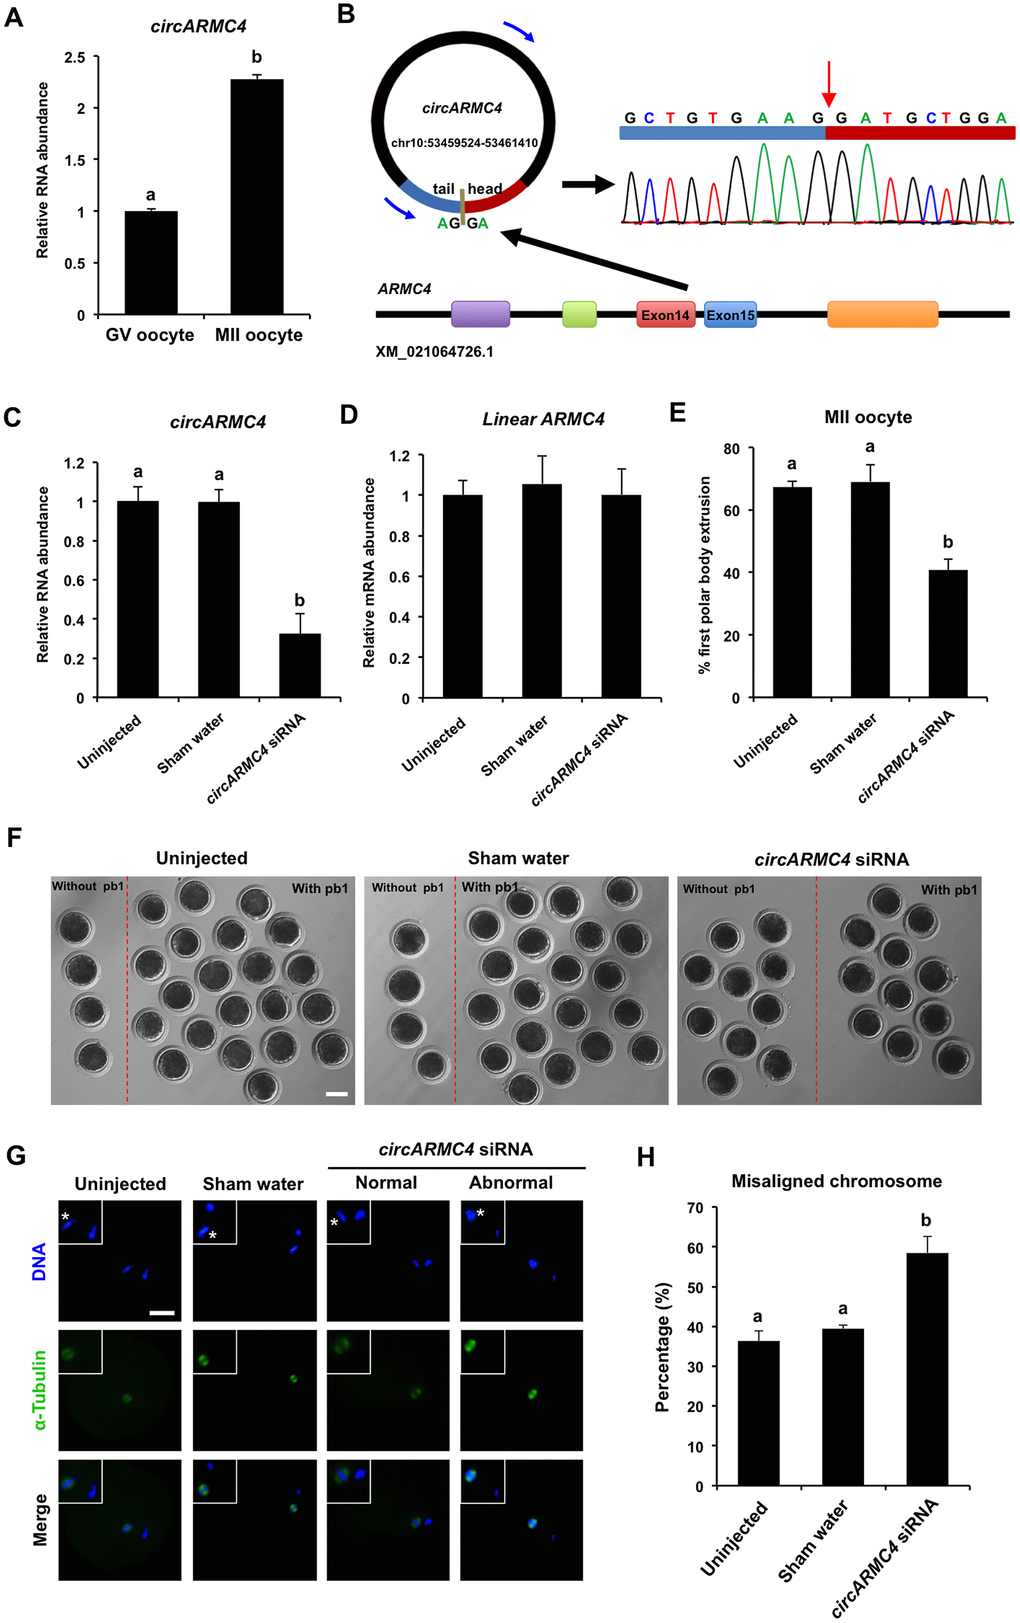
Figure 5.Effect of circARMC4 knockdown on oocyte meiotic maturation and chromosome alignment. (A) CircARMC4 expression in both GV oocytes and MII oocytes. Relative expression of circARMC4 was determined by qPCR. The data are analyzed using student’s t test and are shown as mean ± S.E.M. Different letters on the bars indicate significant differences (P < 0.05). (B) Schematic illustration showed the ARMC4 exon 14 and exon 15 circularization forming circARMC4 (blue arrow). The presence of circARMC4 was validated by qPCR, followed by Sanger sequencing. Red arrow represents “head-to-tail” circARMC4 splicing sites. The expression levels of circARMC4 (C) and linear ARMC4 (D) in the MII oocytes derived from GV oocytes. GV oocytes were injected with circARMC4 siRNA, followed by maturation in vitro for 44 h. Oocytes injected with water and uninjected oocytes were served as a sham control and a blank control, respectively. One hundred matured oocytes were collected for qPCR analysis. Relative abundance of circARMC4 and linear ARMC4 was determined by qPCR from four independent replicates. The data were normalized against endogenous housekeeping gene EF1α1 and the value for the blank control was set as one. The data are shown as mean ± S.E.M. One-way ANOVA was used to analyze the data and different letters on the bars indicate significant differences (P < 0.05). (E) Analysis of the rate of oocyte maturation. The number of oocytes with first polar body after in vitro maturation for 44 h was recorded and the rate of first polar body extrusion was statistically analyzed by one-way ANOVA. The experiment was repeated four times with at least 100 oocytes per group. The data are shown as mean ± S.E.M and different letters on the bars indicate significant differences (P < 0.05). (F) Representative images of oocytes after in vitro maturation. The oocytes without pb1 and the oocytes with pb1 were shown in both the left side and the right side of each image, respectively. Scale bar: 100 μm. (G) Spindle and chromosome morphology in MII oocytes. Matured oocytes were stained for α-tubulin (green) and DAPI (blue). Shown are representative images obtained using confocal laser-scanning microscopy. The experiment was independently repeated three times with at least 40 oocytes per group. Bottom panel in each group shows the merged images between α-tubulin and DNA. White square insets indicate both spindles and chromosomes at a more focused view. Asterisks indicate chromosomes. Scale bar: 50 μm. (H) Analysis of the percentage of oocytes with abnormal chromosome morphology. The chromosome morphology of MII oocytes was scored according to a published method. The data were statistically analyzed by one-way ANOVA. The data are shown as mean ± S.E.M and different superscripts on the bars indicate significant differences (P < 0.05).