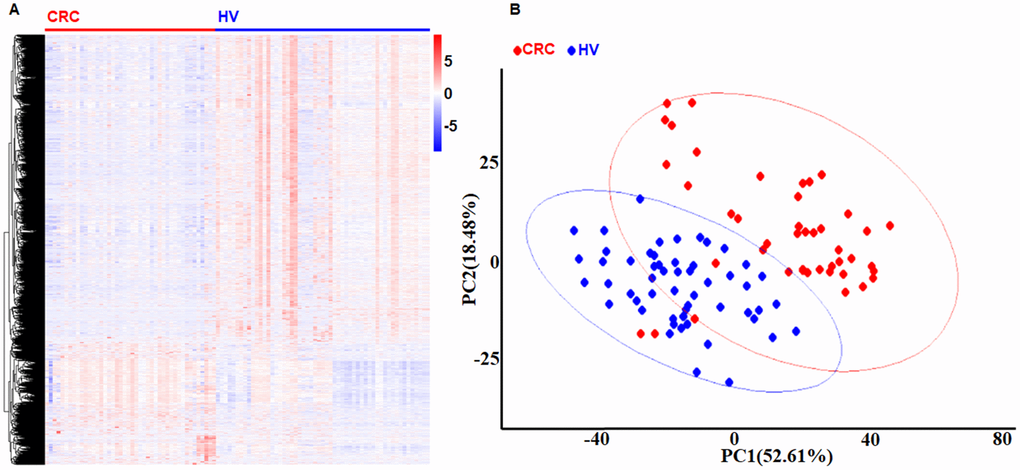
Figure 1.Identification DEGs in platelets from CRC and HVs. (A) The heat-map of gene expression profiles in platelets from CRC and HVs. Red indicates a higher expression and green indicates a lower expression. (B) The PCA plot of gene expression profiles in platelets from CRC and HVs. Red bar: CRC group. Blue bar: HV group.