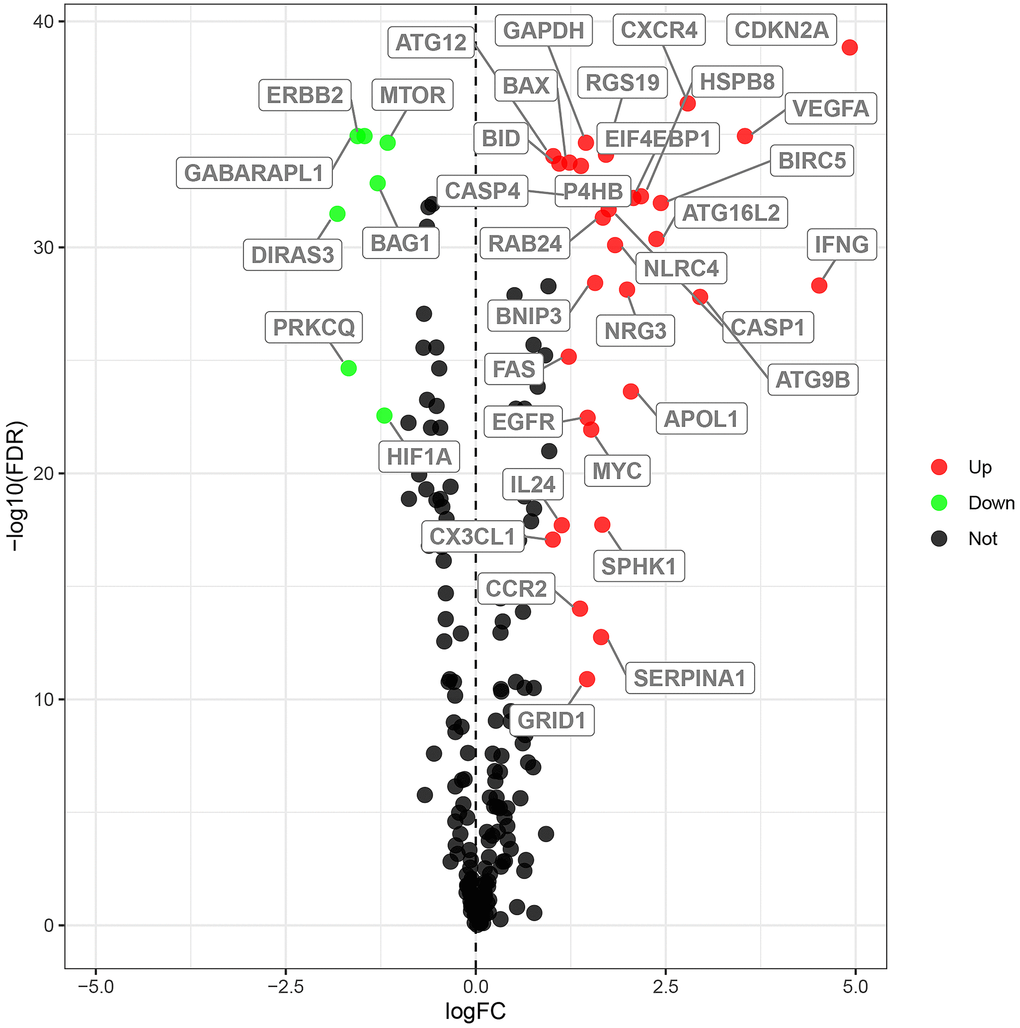
Figure 1.Differential expression of autophagy-related genes in ccRCC tissue samples. The differential expression of 238 autophagy related genes (ARGs) in ccRCC tissue samples (n=539) compared with normal healthy kidney samples (n=72) is shown in the –log (FDR) vs. log (FC) plot. The red dots represent 31 upregulated DEARGs, the green dots represent 7 downregulated DEARGs, and the remaining black dots represent ARGs that are not differentially expressed in ccRCC tissue samples.