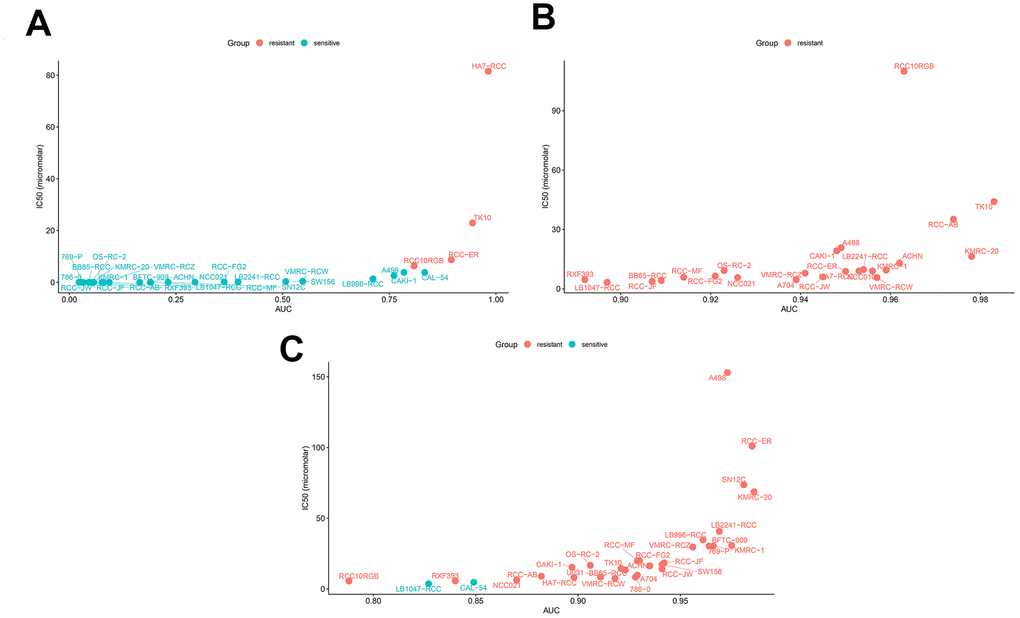
Figure 10.Drug sensitivity analyses of ccRCC cell lines. The AUC versus IC50 plots show sensitivity of several ccRCC cell lines to treatment with (A) Sepantronium bromide, (B) Axitinib, and (C) Cabozantinib. The cell lines with IC50 values that are greater than the maximum screening concentrations used for the targeted drugs are considered to be resistant to the corresponding drugs. The green dots denote drug-sensitive ccRCC cell lines and red dots denote drug-resistant ccRCC cell lines. IC50 =half maximal inhibitory concentration; AUC: Area under the dose-response curve.