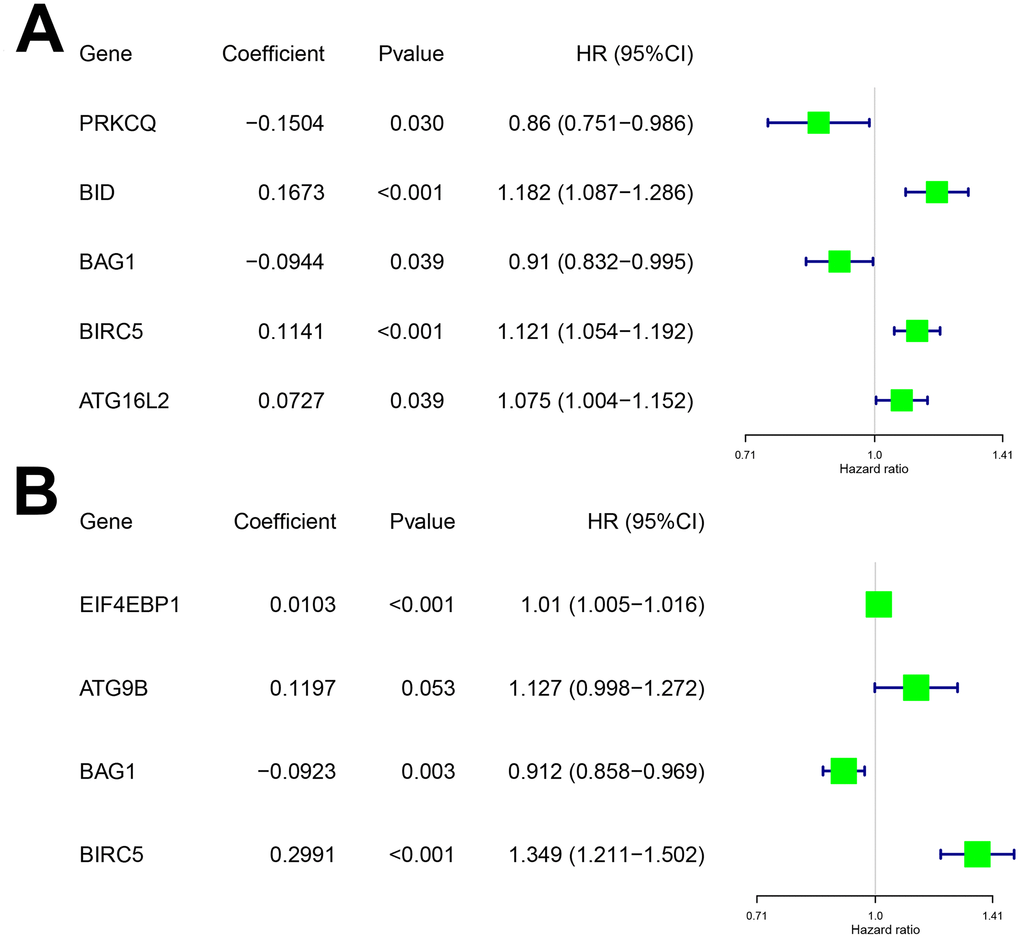
Figure 2.Characteristics of risk DEARGs in the prognostic risk models. Regression coefficients and hazard ratios of the risk DEARGs for the (A) Overall survival (OS) and (B) Disease-Free Survival (DFS) models are shown.
Figure 2 — Differentially expressed autophagy-related genes are potential prognostic and diagnostic biomarkers in clear-cell renal cell carcinoma | Aging