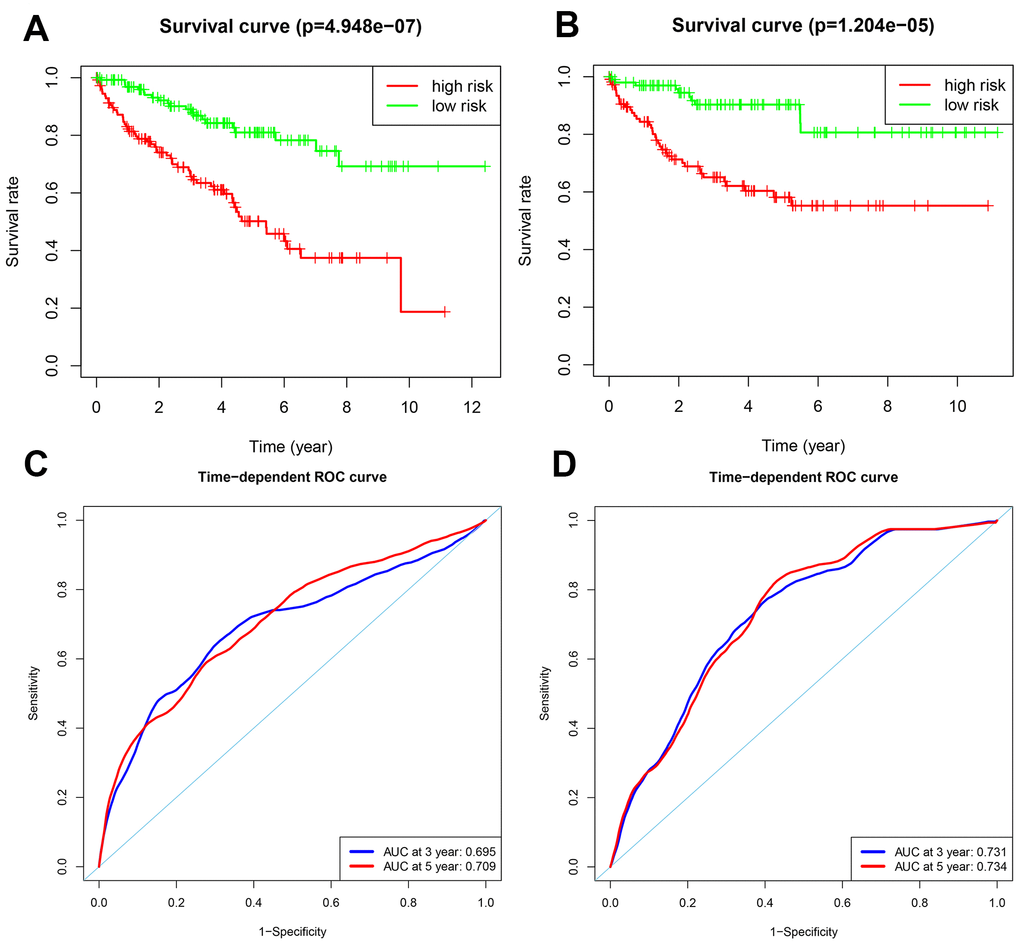
Figure 5.Validation of the OS and DFS prognostic risk models in the testing group ccRCC patients. (A) Kaplan-Meier survival curve analysis of OS in the high-risk (red line) and low-risk (green line) ccRCC patients in the testing group. (B) Kaplan-Meier survival curve analysis of DFS in the high-risk (red line) and low-risk (green line) ccRCC patients in the testing group. (C) Time-dependent ROC curve analyses shows AUC values for 3-year (blue) and 5-year (red) OS in the testing group ccRCC patients. (D) Time-dependent ROC curve analyses shows AUC values for 3-year (blue) and 5-year (red) DFS in the testing group ccRCC patients.