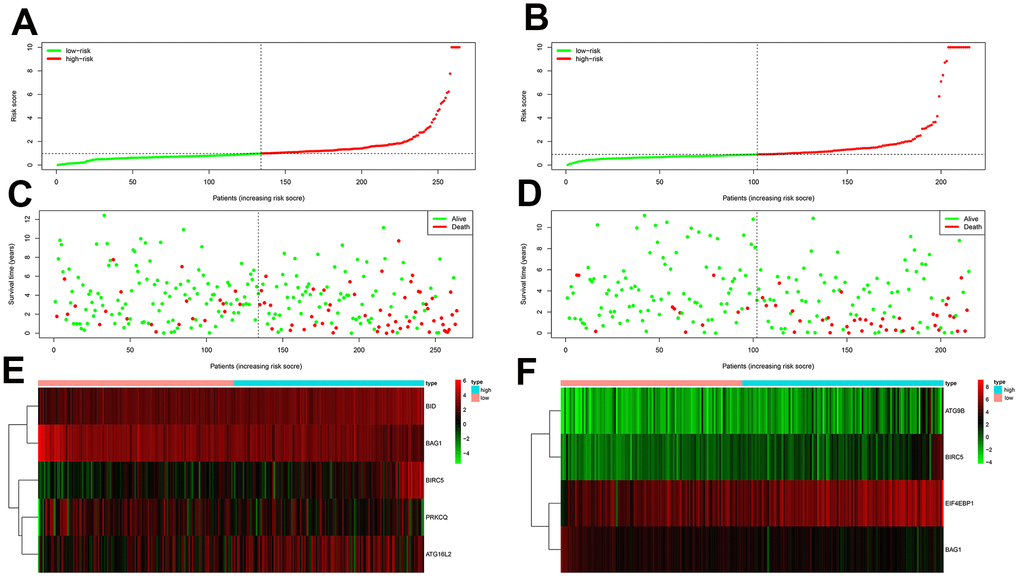
Figure 6.Prognostic analyses of high-risk and low-risk ccRCC patients in the testing group. (A) Risk score distribution of high risk (red) and low-risk (green) ccRCC patients from the testing group using the OS model. (B) Risk score distribution of high risk (red) and low-risk (green) ccRCC patients from the testing group using the DFS model. (C) Scatter plots show survival status of testing group ccRCC patients using the OS model. (D) Scatter plots show survival status plots of testing group ccRCC patients using the DFS model. (E) Expression of risk genes in the high-risk (blue) and low-risk (pink) testing group ccRCC patients in the OS model. (F) Expression of risk genes in the high-risk (blue) and low-risk (pink) testing group ccRCC patients in the DFS model. The color code for gene expression in E and F shows green denoting lowest expression and red denoting highest expression.