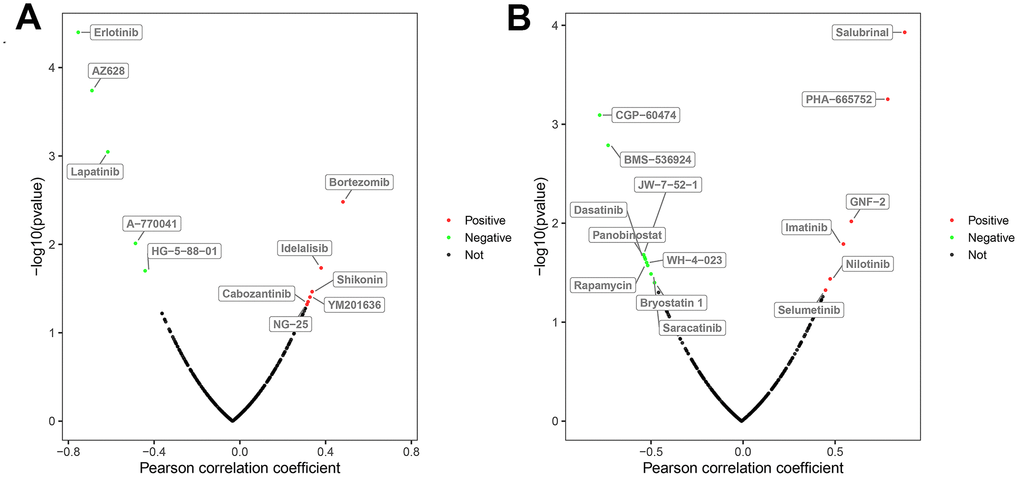
Figure 9.Correlation between the expression status of risk DEARGs and drug sensitivity of ccRCC cell lines. The plot shows the correlation between the expression status of (A) BAG1 and (B) BIRC5 genes relative to the sensitivity of several ccRCC cell lines to various drugs. The green dots represent drugs that negatively correlate with the expression of the risk genes (p < 0.05) based on their IC50 values; red dots indicate positive correlation of the corresponding drugs with the expression of risk genes (p < 0.05) based on their IC50 values; and black dots represent drugs that do not show any significant correlation based on their IC50 values with the expression of risk genes (p > 0.05).