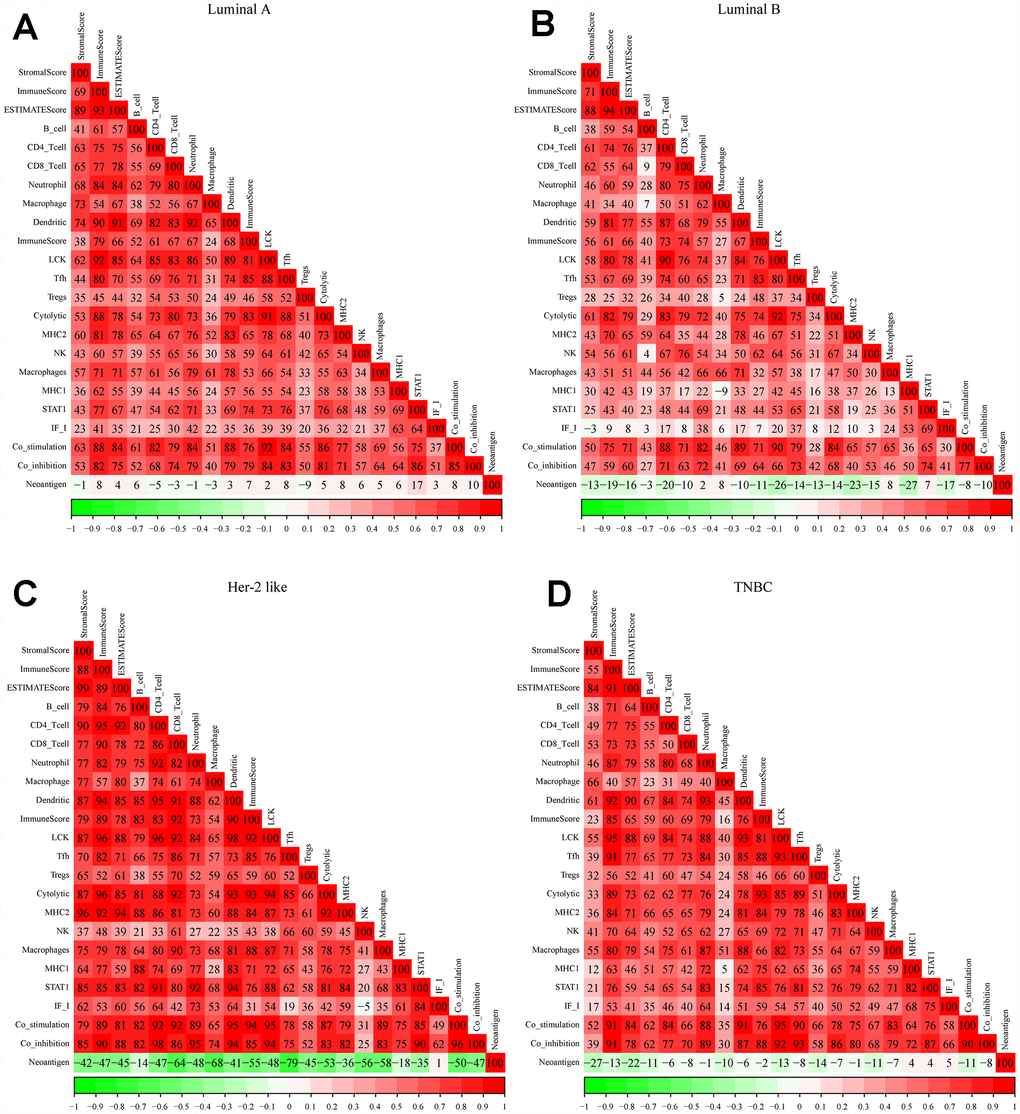
Figure 1.Correlations between different immune scores in patients with different breast cancer subtypes. (A) Luminal A subtype, (B) Luminal B subtype, (C) Her-2-like subtype, (D) TNBC subtype. Spearman correlation coefficients are color-coded to indicate positive (red) or negative (green) associations.