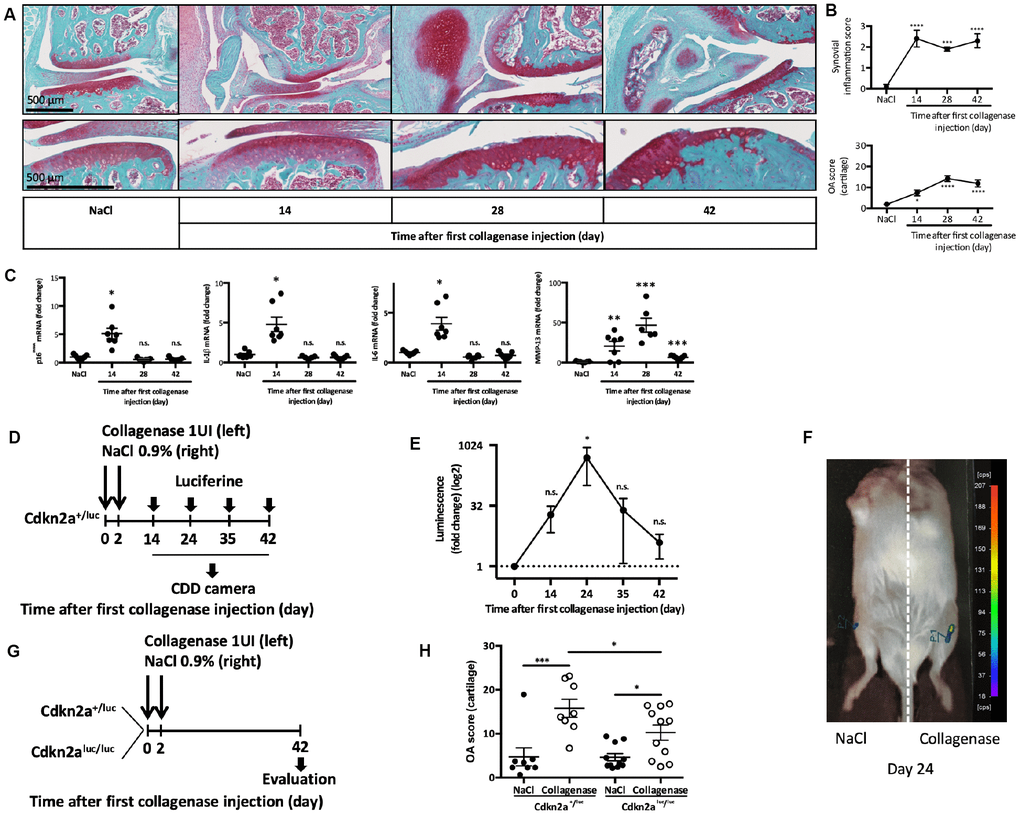
Figure 1.p16INK4a is involved in experimental collagen-induced osteoarthritis. Osteoarthritis (OA) was induced by collagenase intra-articular injection in the left knee (NaCl injection in the right knee for control) of 2-month-old C57BL/6JRj male mice. (A) Representative images of OA kinetic development after intra-articular collagenase injection showing synovial inflammation and osteophytosis (top panel) and focus on cartilage degradation (bottom panel). (B) Synovial inflammation quantification (synovitis semi-quantitative score; from 0 to 3) and cartilage degradation score (OA modified score according to van den Berg; from 0 to 30) were analyzed at day 14, 28 and 42 post-injection and compared with NaCl control at day 42. Data are the mean ± SEM (n=8), *=p<0.05, ***=p<0.001, ****=p<0.0001. (C) p16INK4a, IL-1β, IL-6 and MMP-13 mRNA expression levels in the synovial membrane after NaCl or collagenase injection, measured by RT-qPCR. Results were expressed as fold change compared with NaCl control at day 42. Graphs represent the mean ± SEM (n=8); *=p<0.05, **=p<0.01, ***=p<0.001. (D) Experimental design of p16INK4A expression analysis in Cdkn2a+/luc after OA induction. (E) Luminescence analysis in both knees with a CDD camera after intra-peritoneal and intra-articular Cyc-Luc injection. Values for the left knee (collagenase injection) were expressed as fold change relative to the right knee (control). Data are the mean ± SEM (day 14, n=13; day 24, n=6; day 35, n=6; day 42 n=8); *=p<0.05. (F) Representative image of luciferase signal in the left (CIOA) and right (NaCl) knee at day 24. (G) Experimental design of OA induction in Cdkn2a+/luc and Cdkn2aluc/luc mice. (H) Cartilage degradation score at day 42 after NaCl (control) or collagenase (CIOA) injection in 2-month-old Cdkn2a+/luc and Cdkn2aluc/luc mice. Data the mean ± SEM (n=8 and 11 respectively); *=p<0.05, ***=p<0.001.