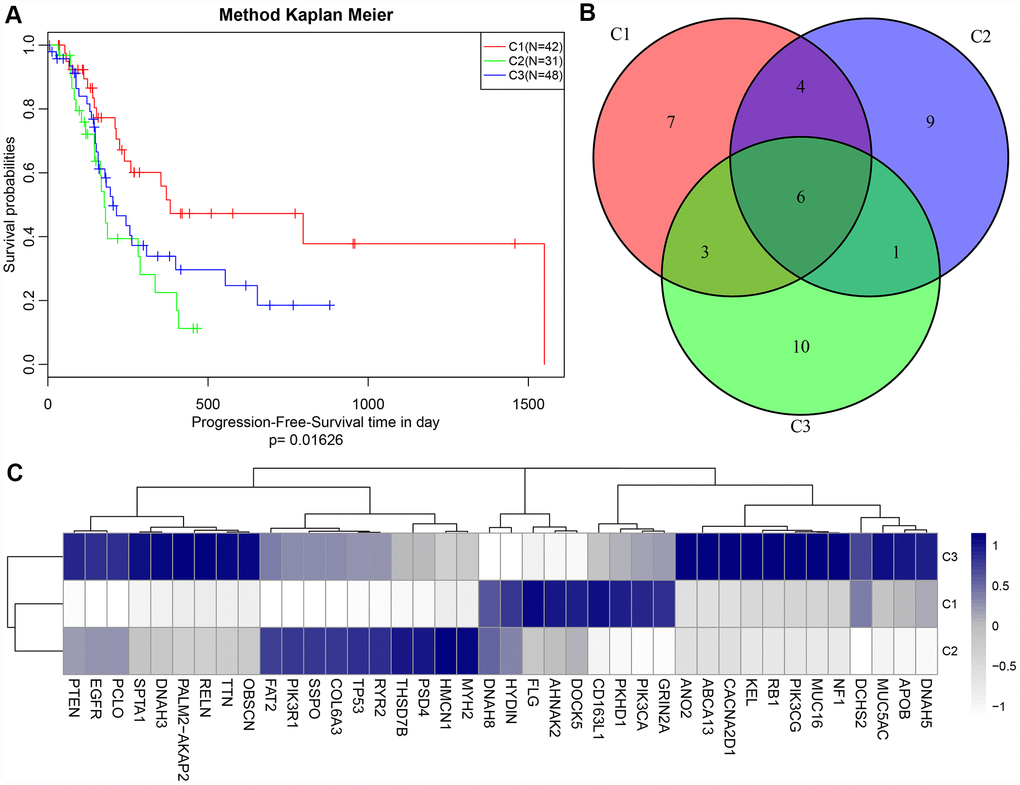
Figure 1.(A) Kaplan-Meier (KM) curves of disease-free survival (DFS) for three subtypes, p = 0.01626; (B) Venn plot of the top 40 genes with most frequent mutations in each subtype. 6 genes overlapped in all three subtypes; (C) Heat map of top 40 genes with the highest mutation frequency in each subtype.