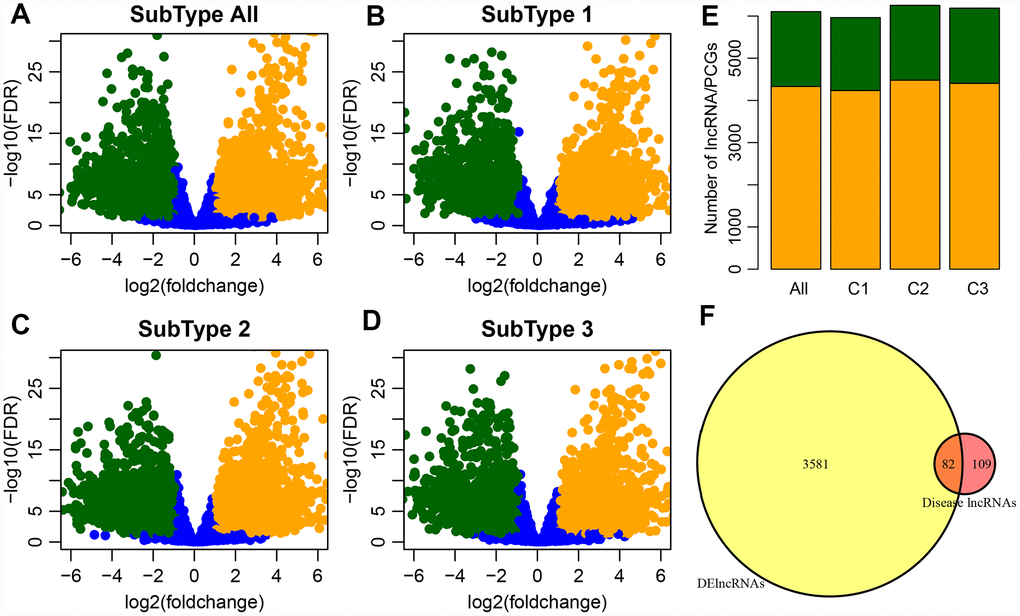
Figure 2.(A) Volcano plot shows the upregulated and downregulated lncRNAs in the GBM patients. The horizontal axis represents fold-change, whereas, the vertical axis represents the P value estimated by edgeR in GBM patient samples. (B–D) Volcano plots for DE-lncRNAs in the three GBM subtypes which correspond to three clusters (C1-C3) of GBM patients from integrative clustering of multiple data types. (E) Distribution of differential expression lncRNA and differential expression coding genes among groups, orange for genes, green for lncRNA. (F) Venn plot of disease-related lncRNA and differential lncRNA, p < 0.01.