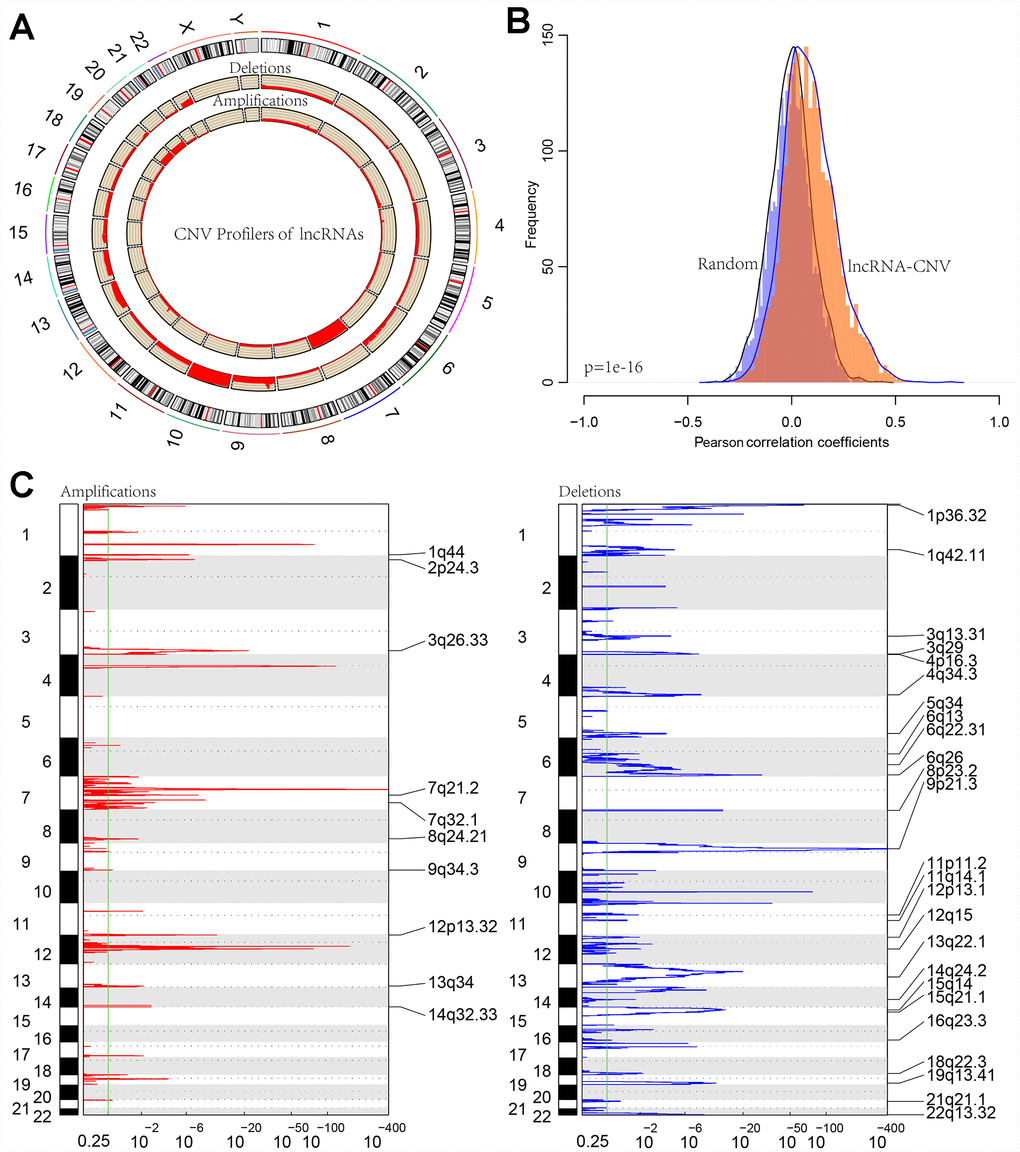
Figure 6.(A) CIRCOS plot shows the genome-wide view of CNV in lncRNA genes. The outer ring sections represent the chromosomes. Each section/chromosome size is relative to each other. The CIRCOS plot is divided into three tracks. The histogram in the outer track displays the CNV of the GBM-related lncRNAs. The two inner tracks display amplification and deletion of chromosome. (B) The distribution of Pearson correlation coefficients between copy number and expression profiles of lncRNAs. (C) The lncRNAs located in the focal CNA peaks are GBM-related. FDRs (q values) and scores from GISTIC 2.0 for alterations (x-axis) are plotted against genome positions (y-axis); dotted lines indicate the centromeres. The amplifications and deletions of lncRNAs are also shown.