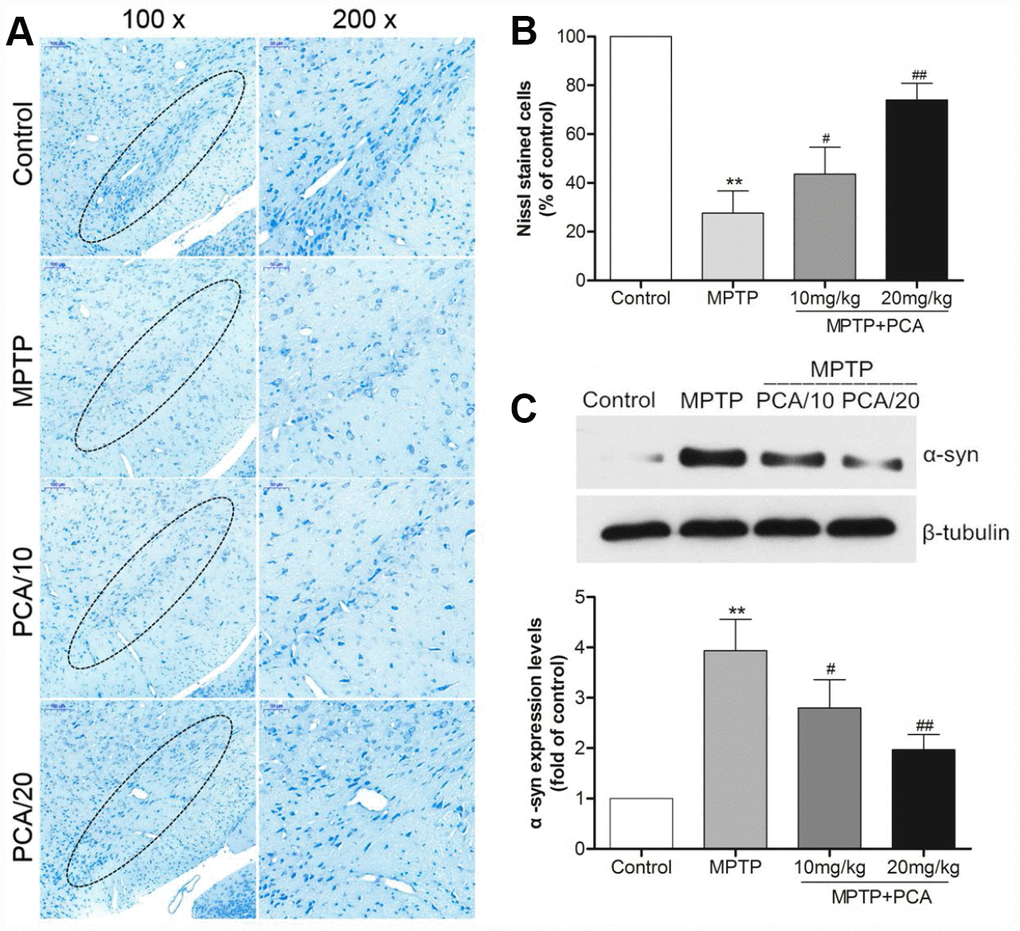
Figure 3.PCA inhibited neuronal degeneration in MPTP-intoxicated mice. (A) Nissl staining in SN. (B) Nissl-positive cells were quantified. (C) Representative western blot bands and quantification of α-Syn levels in each group. Scale bar, 50 μm. Data were expressed as mean ± S.D., n = 6; *P< 0.01vs. control group, #P< 0.05 vs. MPTP group.