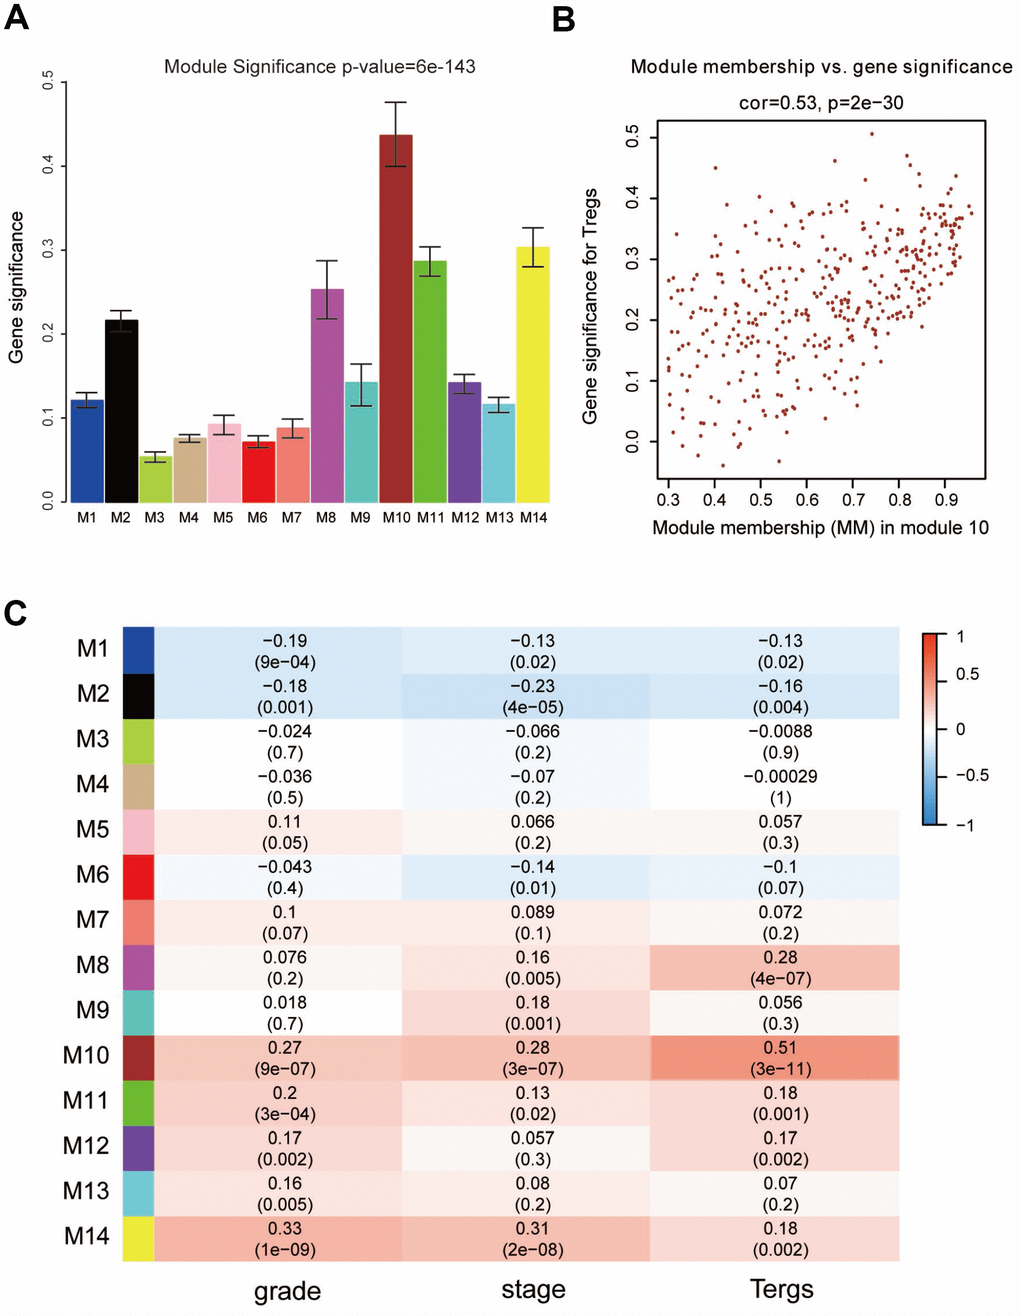
Figure 4.Identification of modules associated with clinical characteristics. (A) Distribution of average gene significance and errors in the modules associated with the proportion of Treg cells in ccRCC. (B) Scatter plot of module eigengenes in module 10. (C) Heatmap of the correlation between module eigengenes and different clinical characteristics of ccRCC.