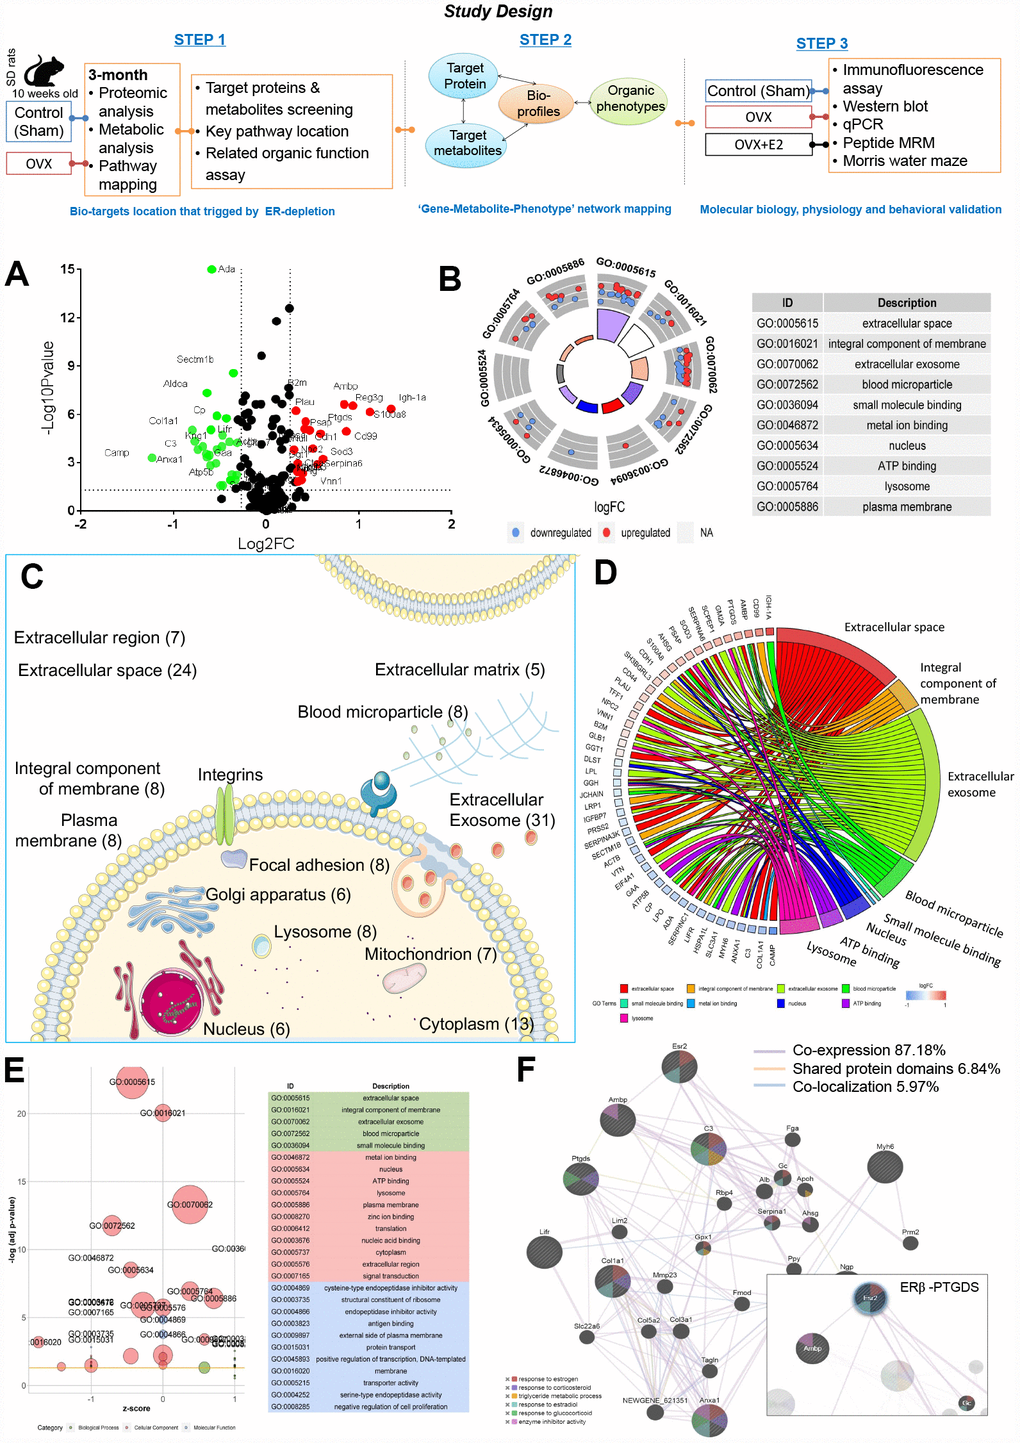
Figure 1.Ovarian failure induced overall proteomic regulation dysfunction as shown by proteomic analysis. (A) Volcano plot of differential proteins screened between control and OVX rats (normalized by control sample data). (B) GO Circle plot for significant enrichment of cellular components (CC) for genes that are strong candidates for ovarian failure-induced dysfunction. (C) Subcellular locations of ovarian failure proteins annotated by Gene Ontology. (D) GO-Chord plot illustrating the gene-annotation enrichment relationships and representative significant GO terms that are distinctly classified into species-specific gene clusters. (E) GO-Bubble plot illustrating significant enrichment of molecular functions and biological processes (adjusted p-value ˂ 0.05) and the z-score of the term (F) Protein–protein interaction network identified using GeneMANIA (direct interaction database).