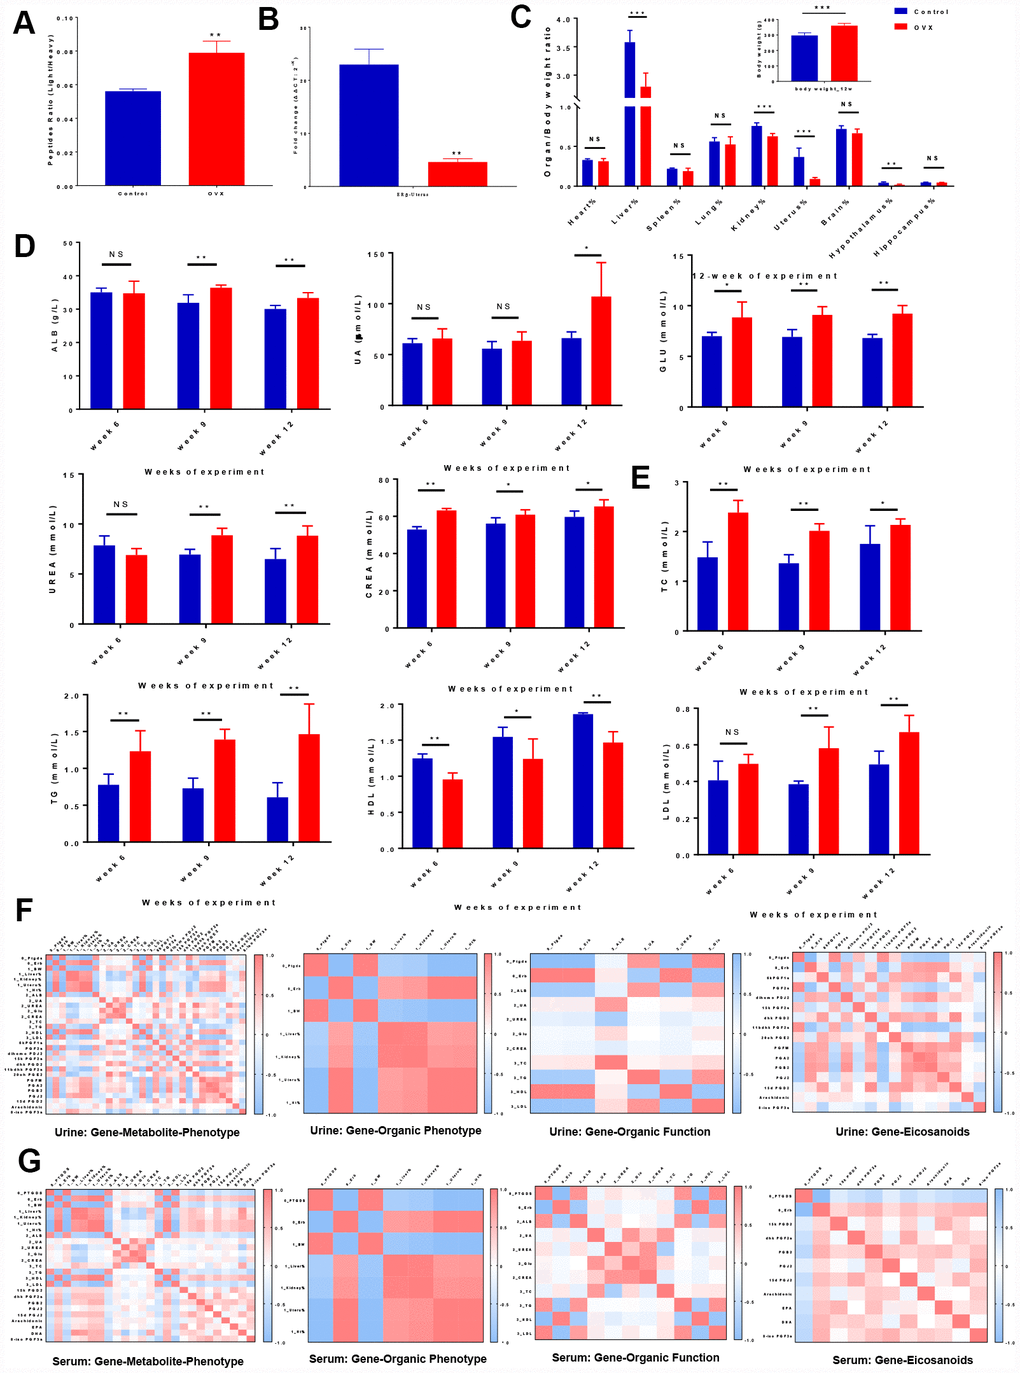
Figure 3.Correlation analyses illustrated the relationships among ‘genes-metabolites-phenotypes’ in ER-depletion-induced renal lipid metabolism disorder. (A) Relative peptide quantification in control and OVX rat urine samples. n=3, mean ± s.e.m.; (B) Real time PCR assays of uterus ERβ among control, OVX and OVX+E2 rats. n=3, mean ± s.e.m.; (C) Average weekly body weight (g) from 0 to 12 weeks before and after surgery and average organ/body weight ratio (organ %) at 12 weeks after surgery. (D) Kidney biochemical profiles in the sera of control and OVX rats. (E) Lipid biochemical profiles in the sera of control and OVX rats. n=6, mean ± s.d., compared to control rats, *p ˂ 0.05, **p ˂ 0.005, ***p ˂ 0.0005. Correlation heat map representation of the differentially expressed gene and metabolite markers in organs, renal biochemistry, and lipid biochemistry phenotypes including genes clustered into organ phenotypes, subsets of genes clustered into organ functions and subsets of genes clustered into eicosanoid markers in urine (F) and serum (G).