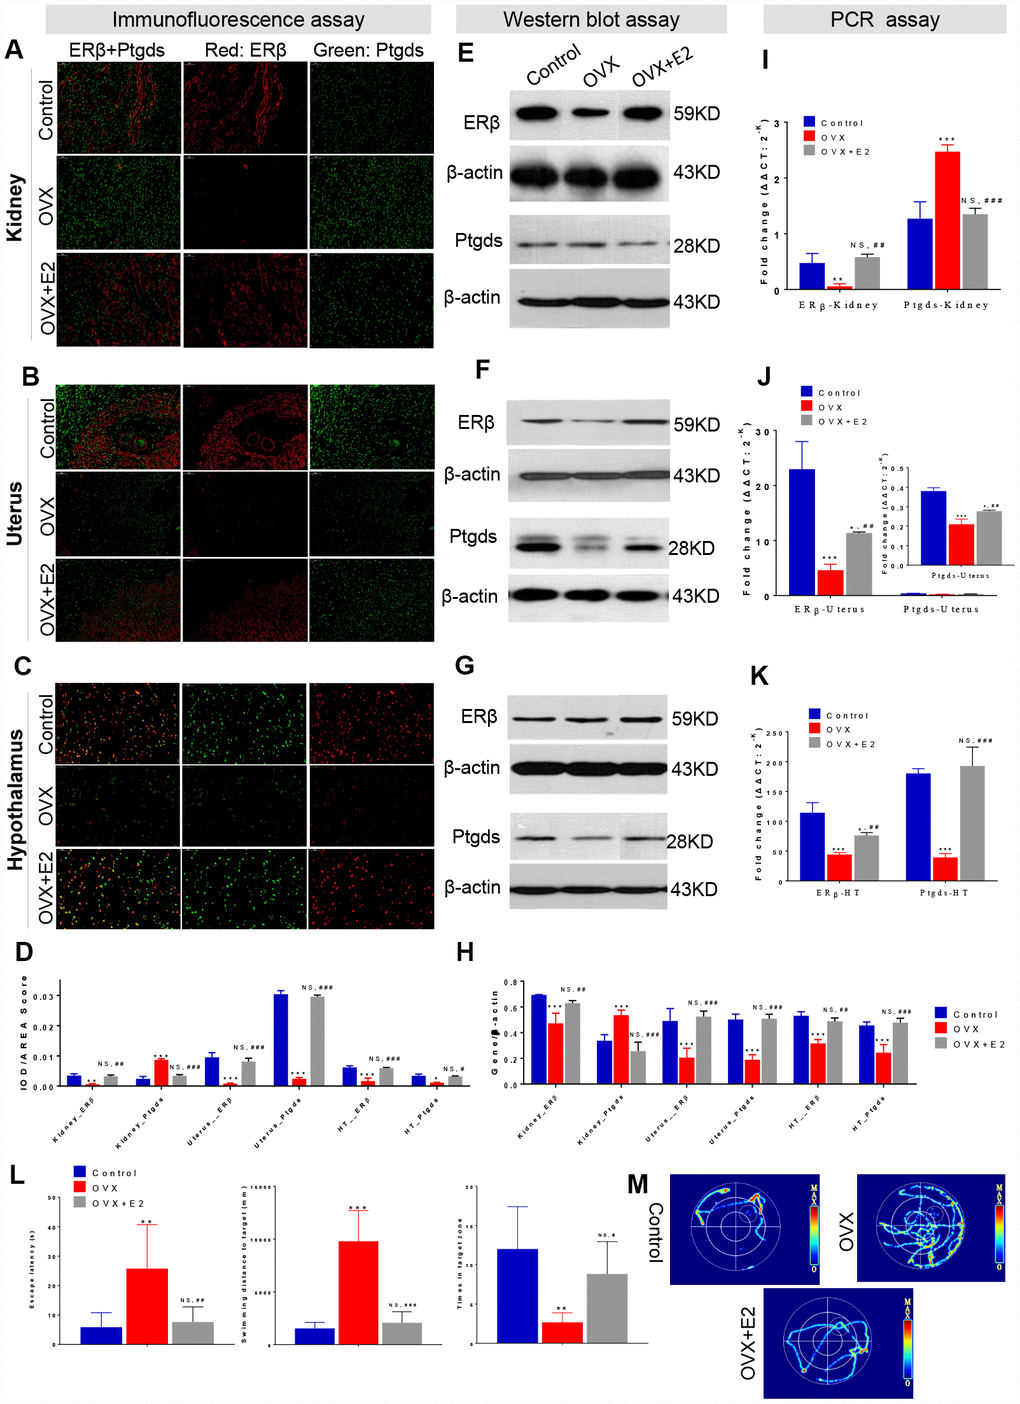
Figure 4.ER-depletion reduce HUK functions attribute to ERβ/Ptgds signalling pathway disturbance. Immunofluorescence (IF) analysis including the staining images (A–C) and AOD calculation data (D) in the left panel shows the double staining of ERβ (red) and Ptgds (green) from kidney (A), uterine (B), and hypothalamic (C) among control, OVX, and E2+OVX rats. Scale bar, 50 μM. The AOD ratio indicates the ratio of optical density (IOD) and values to staining area (AREA). Western blot (WB) analysis including the gel images (E–F) and protein loading data (H) in the middle panel present the ERβ and Ptgds proteins expression from kidney (E), uterine (F), and hypothalamic (G) among control, OVX, and E2+OVX rats. n=3, mean ± s.e.m. Real time PCR analysis of the transcription levels of ERβ and Ptgds expression various among control, OVX and OVX+E2 rats along ‘hypothalamus-uterus-kidney axis’ in the right panel (I–K). n=3, mean ± s.e.m., NS, not significant. Morris water maze test including location test and spatial learning test for control, OVX, and E2+OVX rats. As well as (L) escape latency duration, swimming length to the escape platform, number of crossings escape platform position, and (M) the images of total movement towards to the target for control, OVX, and E2+OVX rats. n=6, mean ± s.d., *p < 0.05, **p < 0.005, ***p < 0.0005 versus control rats; #p < 0.05, ##p < 0.005, ###p < 0.0005 versus control rats, NS, not significant.