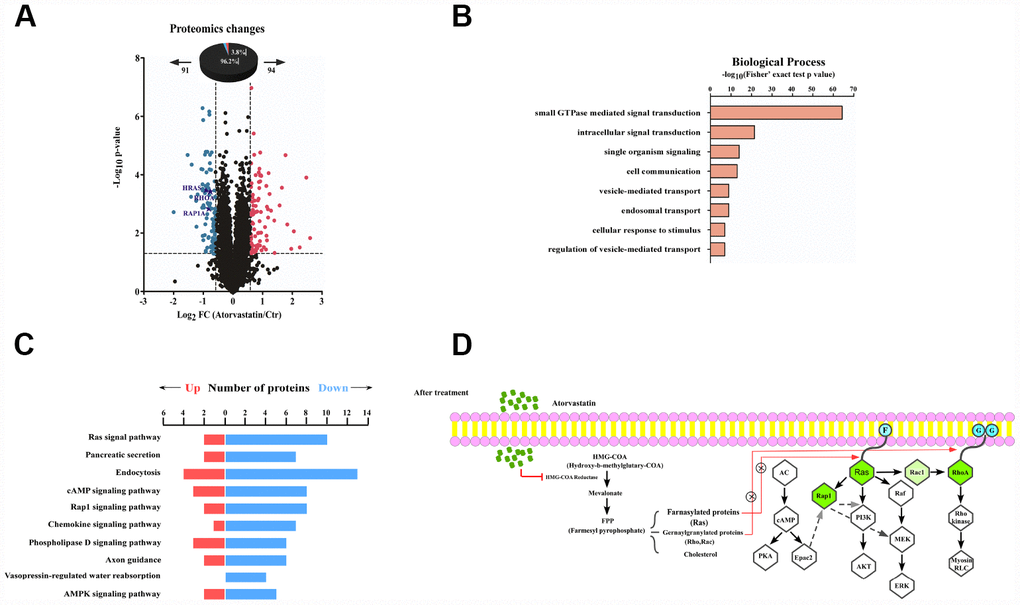
Figure 3.Proteomic analysis reveals the anti-tumor mode of atorvastatin. (A) volcano plot shows that 185 proteins changed significantly (P < 0.05 upon 24 h treatment with 1 μM atorvastatin). Blue dots represent down-regulated proteins, and red dots represent up-regulated proteins. (B) The picture shows biological processes of GO annotation. Bar chart represents biological processes enriched by altered proteins in response to atorvastatin treatment. The P-value (-log10) of each biological process is shown. (C) Pathways that are significantly down-altered in the proteome are shown on the left. The number of significantly regulated proteins in each pathway is shown in red and blue. (D) Proposed mechanisms underlying the action of atorvastatin's anti-tumor. Right shows that atorvastatin inhibits HMG-CoA reductase, and restrains the production of the Mevalonate pathway, which is necessary for Ras and RhoA. Left shows the changed pathway in response to atorvastatin treatment. Green dots are down-regulated proteins in the proteome.