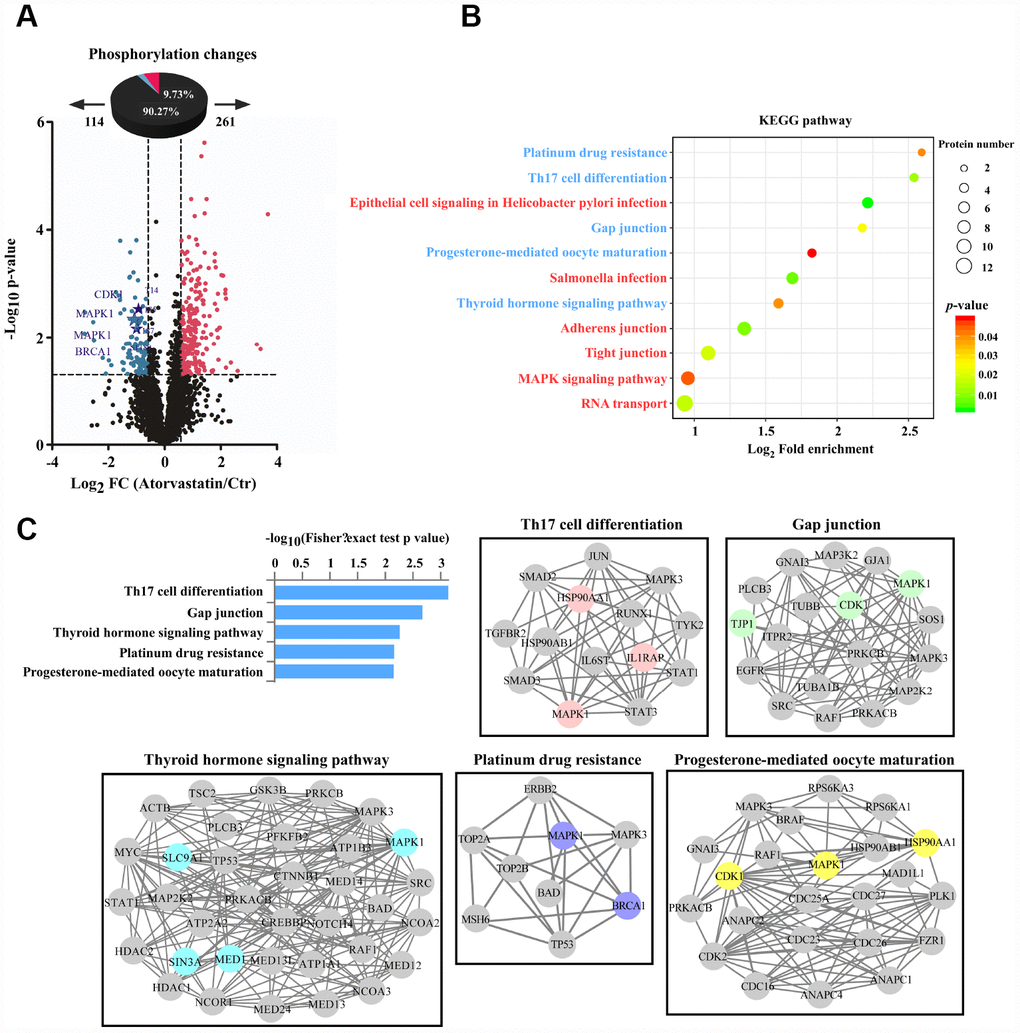
Figure 4.Phosphorylation profiles reveal the anti-tumor mode of atorvastatin. (A) Volcano plot shows that 375 phosphorylation sites changed significantly (P < 0.05 upon 24 h treatment with 1 μM atorvastatin). Blue dots represent down-regulated proteins, and red dots represent up-regulated proteins. (B) KEGG pathways that are significantly regulated (up or down) in phosphorylation are shown according to P -value, and the circle represents the number of mapping proteins. (C) According to the top 5 KEGG terms, these phosphoproteins whose sites were identified upon atorvastatin treatment are mapped to network by STRING database, in which the dot is protein. The colored nodes are significantly down-regulated phosphoproteins. The edges represent the STRING combined interaction score.