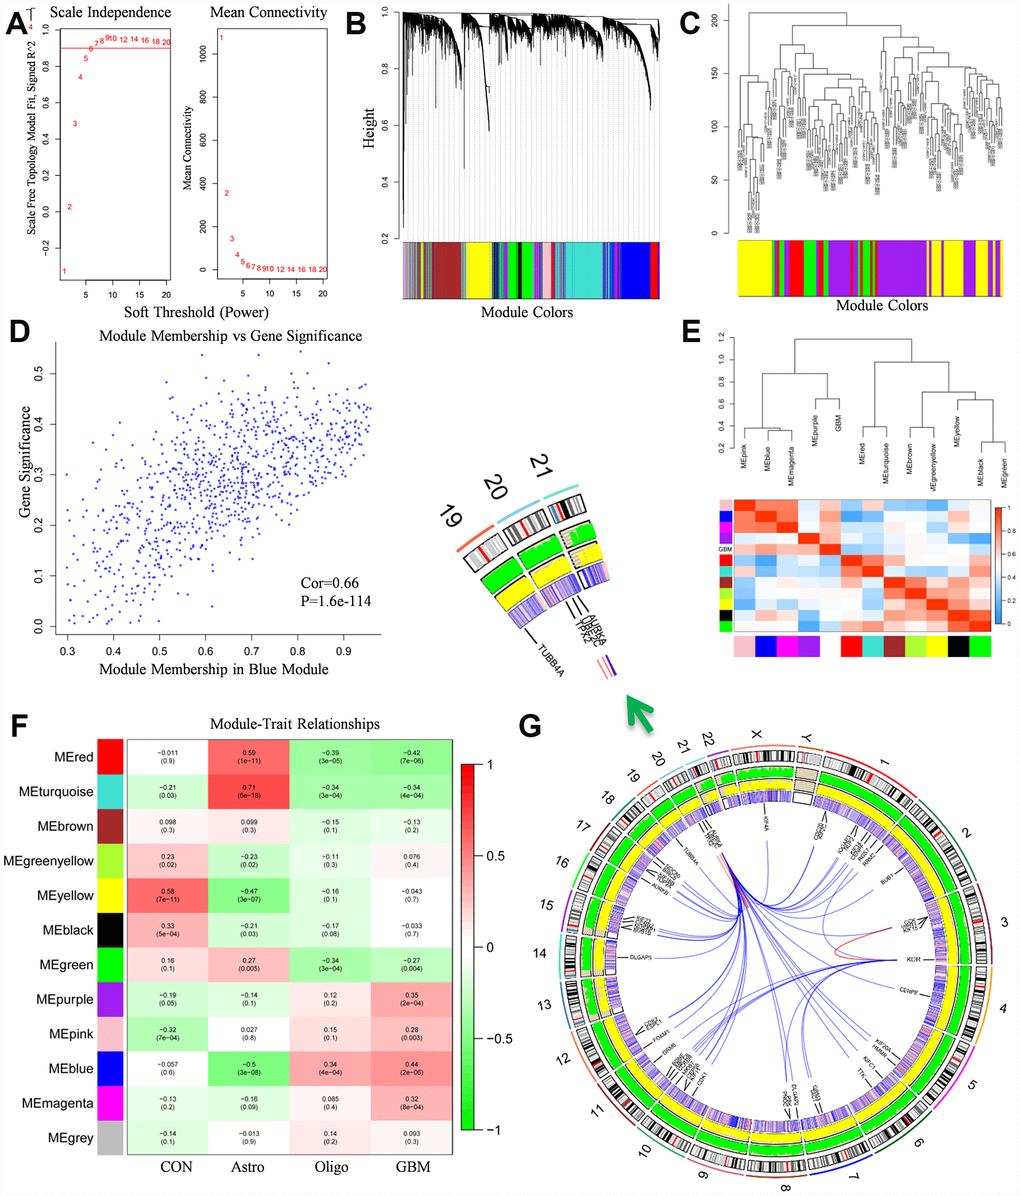
Figure 2.WGCNA analysis results. (A) The soft-thresholding powers selection of WGCNA analysis. The left panel showed the scale-free fit index (y-axis) as a function of soft-thresholding power (x-axis). The red line represented the y-axis value. The right panel showed the mean connectivity (y-axis) as a function of soft-thresholding powers (x-axis). (B) Module assignment and cluster dendrogram. Highly interconnected groups of genes were clustered. Modules were represented by different colors in the horizontal bar. 12 modules were identified with the hierarchical clustering tree analysis. (C) Cluster dendrogram of samples in GSE50161 to detect outliers. The dendrogram branches represented the clustered samples. (D) The correlation between gene significance and module membership in the blue module. The y-axis represented the gene significance in the blue module. The x-axis represented the module membership in the blue module. (E) The heat map of adjacencies in the eigengene network. The adjacency of corresponded modules was represented by column and row square color. High adjacency was represented with red while low adjacency was represented with blue. (F) The module-trait relationship heat map. The column represented clinical features. The first column was control samples. The second column was ependymoma. The third column was medulloblastoma. The fourth column was glioblastoma. The row represented the module eigengene. The first line in every square was the corresponding correlation. The second line in every line was the p-value. The left side of heat map indicated the module name. The right side of heat map indicated the colors of correlation (green represented negatively correlated, red represented positively correlated). (G) The Circos plot of GBM genome showed chromosome structure, gene expression level and gene encoding protein interaction relationship. The chromosome model was the most outer layer. The green and yellow track represented average gene expression level of normal brain tissue and glioblastoma in GSE50161, respectively. The inner track which is consisted of red and blue stripe stand for the p-value in comparison of normal brain tissue and glioblastoma, high p-value was represented with red, vice versa. The most inner track denoted gene encoding protein interaction relationship.