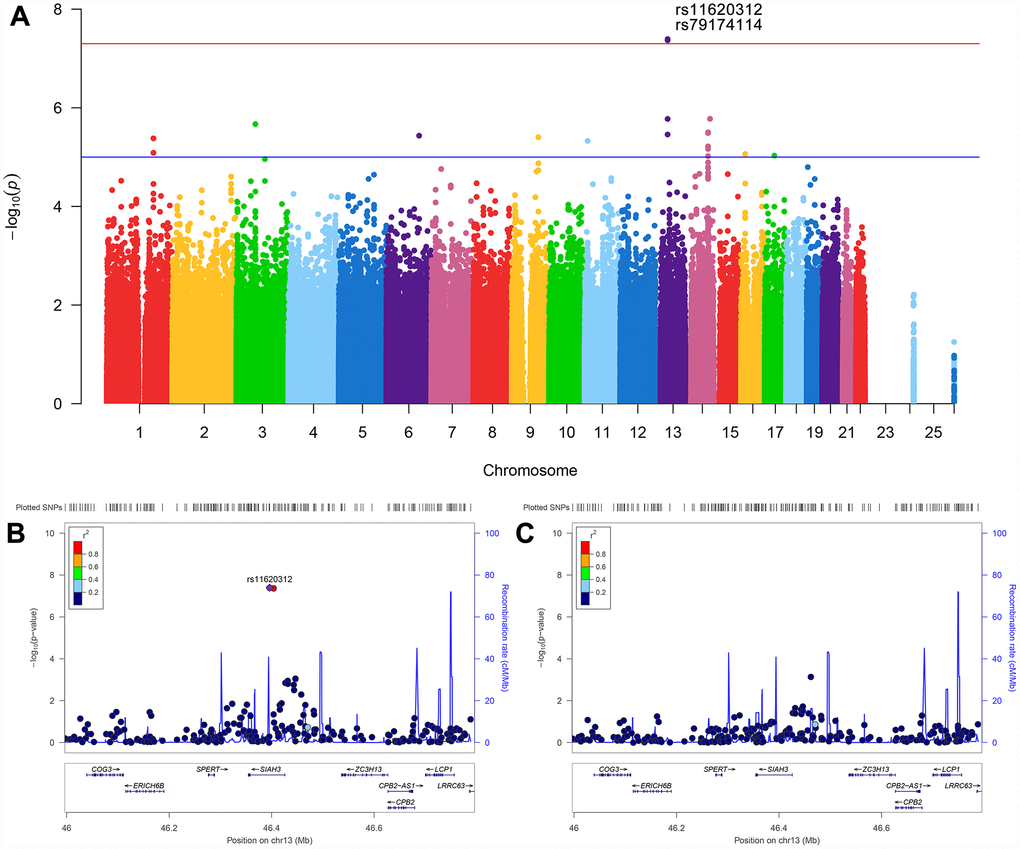
Figure 1.Manhattan plot and regional association plots. (A) Manhattan plot for association with the rate of ventricular enlargement, after adjusting for age, gender, APOE ε4, ICV, MRI scanner type and the first three principal components. The red line is the genome-wide significant threshold at P = 5×10⁻⁸; the blue line is a suggestive threshold at P = 10-5. (B) Regional association plot for rs11620312 in the SIAH3 gene on chromosome 13. (C) Regional association plot for the SIAH3 gene after controlling for rs11620312. No SNPs showed significant association after controlling for rs11620312, suggesting the associations were driven by rs11620312. Abbreviation: ICV = intracranial volume; MRI = magnetic resonance imaging; P = P value.