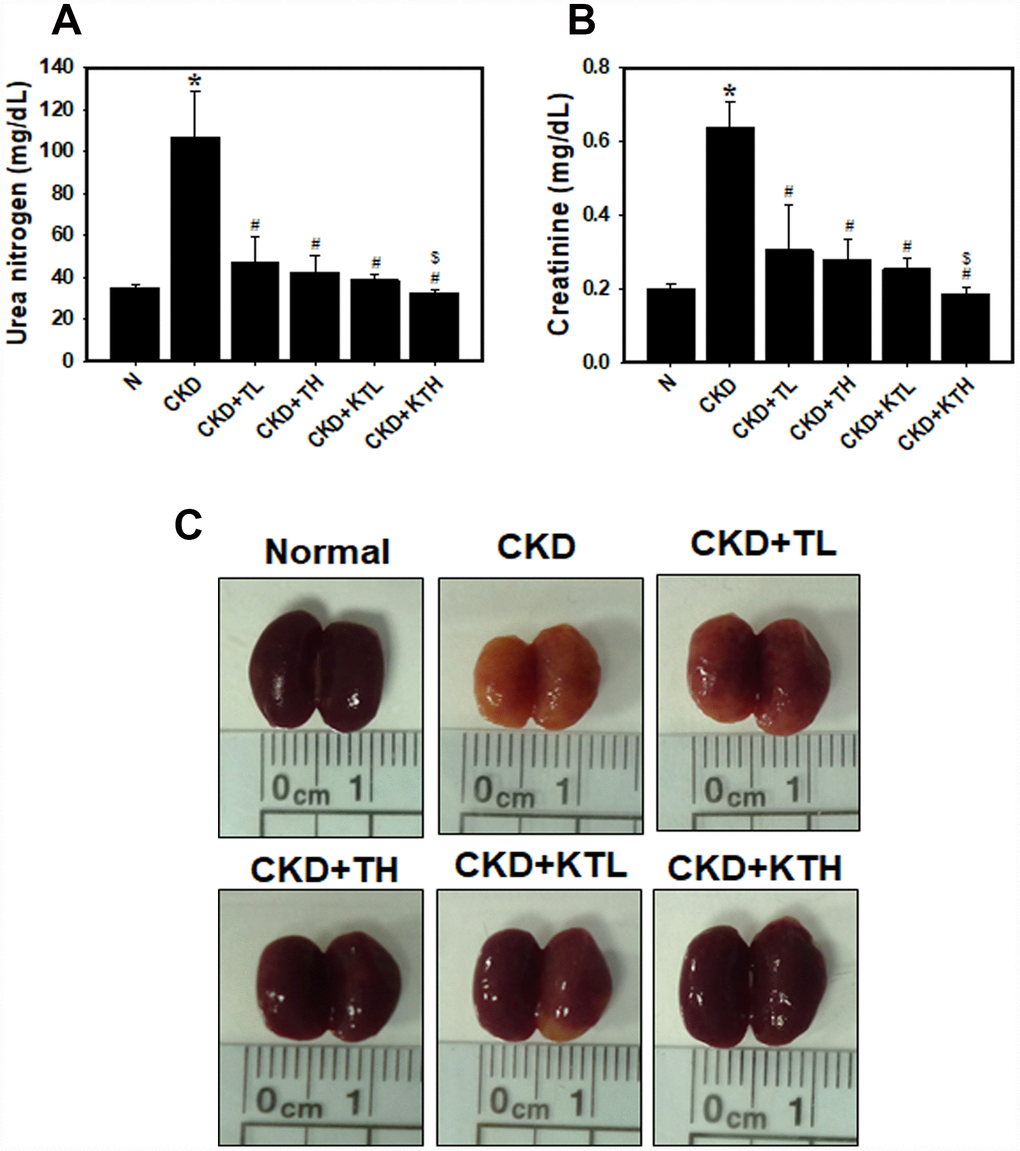
Figure 6.Serum biochemistry parameters and direct observations of the kidneys in an adenine-induced CKD model following TG NP and KIM-1-TG NP treatment. (A) (B) Analysis of serum biochemistry parameters. Creatinine and urea nitrogen levels were assessed after TG NP or KIM-1-TG NP injection. *p < 0.05, normal versus CKD. #p < 0.05 versus CKD. $p < 0.05, CKD+TH versus CKD+KTH. (C) Images of an entire kidney. After the experiments, the mice were sacrificed, and the kidneys were removed. N indicates normal group. CKD indicates that mice are adenine-fed and intraperitoneally injected saline. TL indicates low-concentration (0.1 mg/kg) TG NP group. TH indicates high-concentration (0.2 mg/kg) TG NP. KTL indicates low-concentration (0.1 mg/kg) KIM-1-TG NP group. KTH indicates high-concentration (0.2 mg/kg) KIM-1-TG NP group. Details of the mouse model are described in “Materials and Methods”.