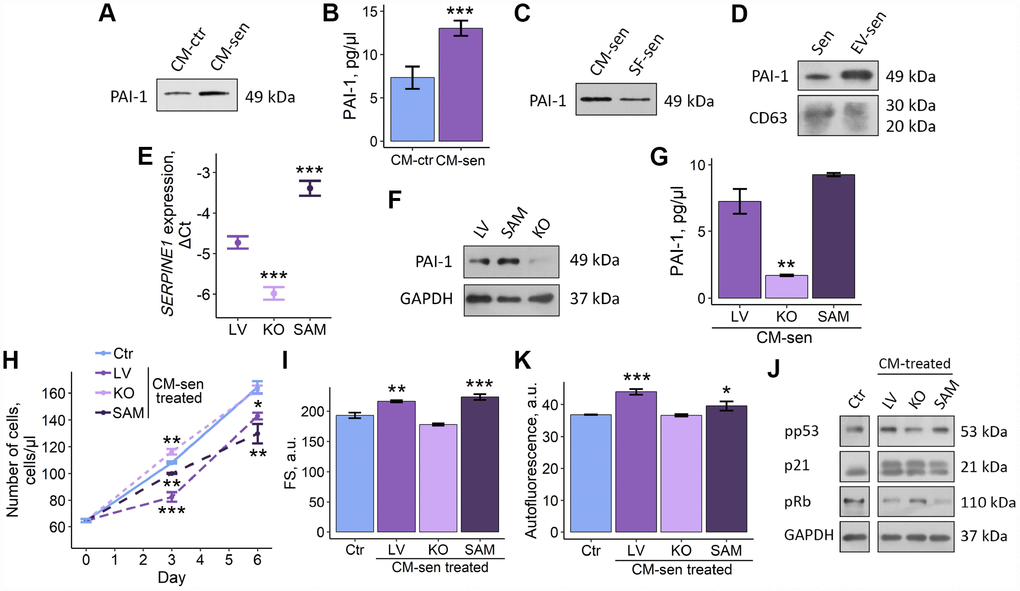
Figure 6.Altered PAI-1 secretion levels modulate SASP-induced senescence propagation within ESCs population. Ctr – young ESCs cultured in standard conditions. Sen – senescent ESCs. CM-ctr and CM-sen – conditioned media from young or senescent ESCs, respectively. SF-sen or EV-sen treated – young ESCs exposed to soluble factors and extracellular vesicles secreted by senescent ESCs, respectively. LV, KO and SAM – gene-modified ESCs with unaffected, down-regulated and overexpressed SERPINE1 gene. CM-sen LV, KO, SAM treated – young ESCs exposed to conditioned media from senescent gene-modified cells. (A, B) Western blot analysis and ELISA of PAI-1 composition in CM-ctr and CM-sen. For western blot CMs were collected from equal numbers of cells and in equal volumes of media. ELISA values presented as M ± S.D. (N=4). *** – p<0.005 by Student’s t-test. (C, D) Western blot of PAI-1 content in SF-sen and EV-sen obtained as described in Experimental procedures section. CD63 was used as EV marker protein. For western blot CMs and SF were collected from equal numbers of cells and in equal volumes of media. (E, F) PAI-1 expression levels in LV, KO and SAM estimated by RT-PCR and western blot, respectively. Values are M ± S.D. (N=3). *** – p<0.005 by ANOVA with Tukey HSD versus Ctr. (G) PAI-1 levels in LV, KO, SAM CM-sen by ELISA. Values are M ± S.D. (N=2). ** – p<0.01 by ANOVA with Tukey HSD versus Ctr. (H, I, K) Growth curves, cell size and autofluorescence of Ctr ESCs or LV, KO, SAM CM-sen treated ESCs by FACS. Cell size and autofluorescence after 6 d of treatment. Forward scatter (FS) reflects the average cell size. Values are M ± S.D. (N=3). * – p<0.05, ** – p<0.01, *** – p<0.005 by ANOVA with Tukey HSD versus Ctr of the same time point. (J) Western blot analysis of p53 and Rb phosphorylation levels and p21 protein expression performed after 6 d of treatment. Representative results of the three experiments are shown in the Figure. GAPDH was used as loading control.