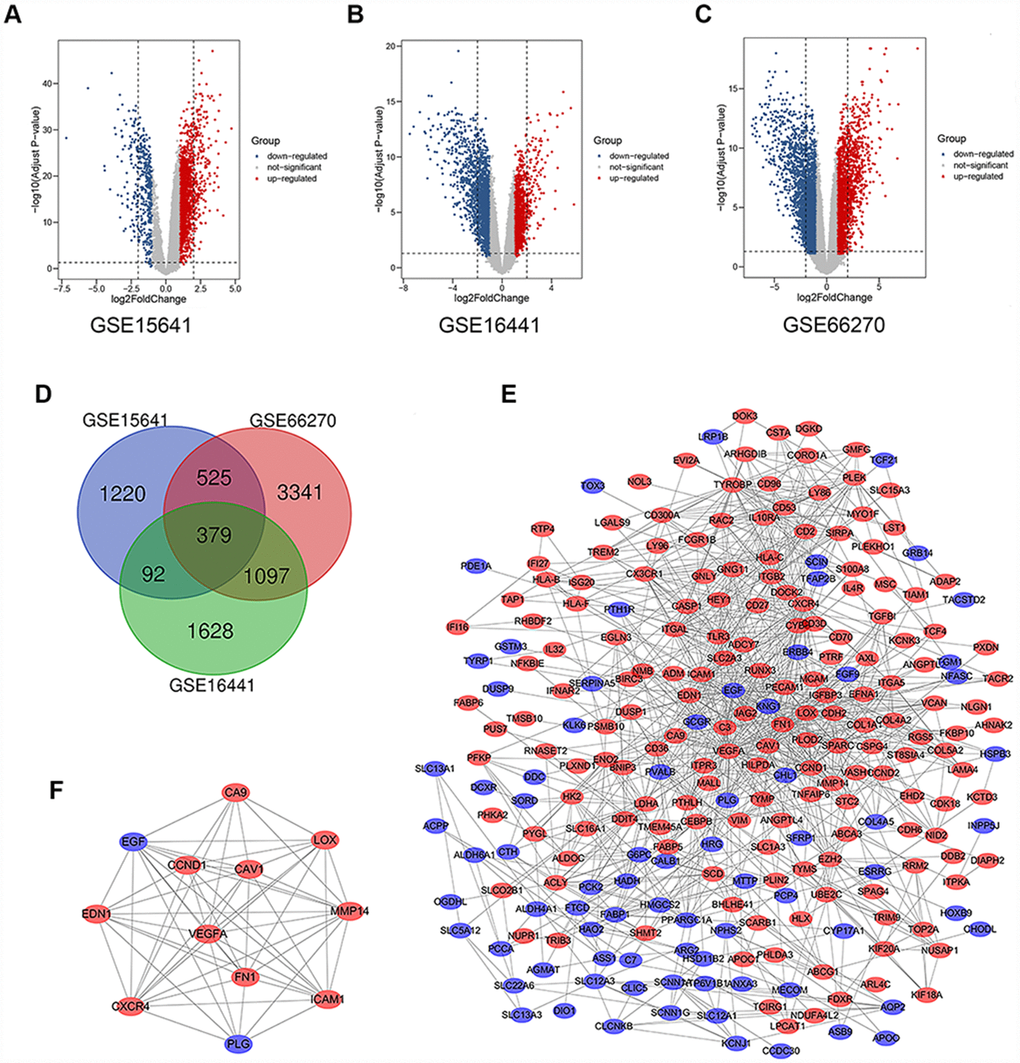
Figure 1.Differential expression of data between two sets of samples, Venn diagram, PPI network and the most significant module of DEGs. (A) GSE15641 data, (B) GSE16441 data, and (C) GSE66270 data. The red points represent upregulated genes screened on the basis of fold change > 1.0 and a corrected P-value of < 0.05. The blue points represent downregulation of the expression of genes screened on the basis of fold change < 1.0 and a corrected P-value of < 0.05. The black points represent genes with no significant difference. (D) DEGs were selected with a |fold change| >1 and P-value <0.05 among the mRNA expression profiling sets GSE15641, GSE16441 and GSE66270. The 3 datasets showed an overlap of 379 genes. (E) The PPI network of DEGs was constructed using Cytoscape. (F) The most significant module was obtained from PPI network with 12 nodes and 58 edges. Upregulated genes are marked in light red; downregulated genes are marked in light blue. Abbreviations: FC: fold change; GEO: Gene Expression Omnibus; DEGs: differentially expressed genes; PPI: protein–protein interaction.