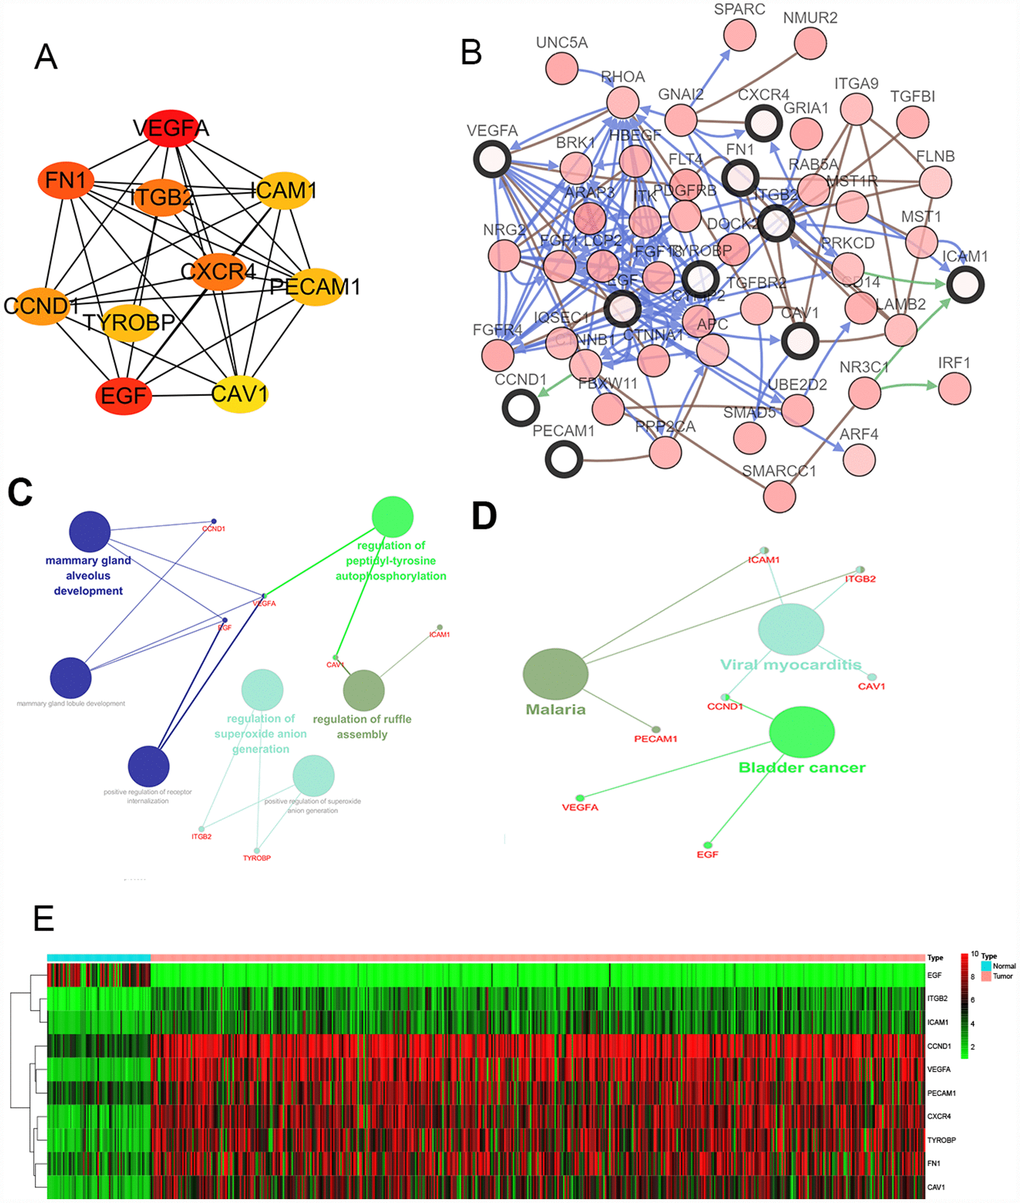
Figure 2.Interaction network and analysis of the hub genes. (A) Screen out the 10 most important hub genes using the cytoscape software plugin cytoHubba. (B) Hub genes and their co-expression genes were analyzed using cBioPortal. Nodes with bold black outline represent hub genes. Nodes with thin black outline represent the co-expression genes. (C) The biologic process functional annotation analysis of hub genes was performed by ClueGO and CluePedia. Different colors of nodes refer to the functional annotation of ontologies. Corrected P value <.01 was considered statistically significant. (D) The KEGG functional annotation analysis of hub genes was performed by ClueGO and CluePedia. Different colors of nodes refer to the functional annotation of ontologies. Corrected P value <.01 was considered statistically significant. (E) Hierarchical clustering heatmap of 10 most important hub genes was constructed depend on TCGA cohort. Red indicates that the expression of genes is relatively upregulated, green indicates that the expression of genes is relatively downregulated, and black indicates no significant changes in gene expression; gray indicates that the signal strength of genes was not high enough to be detected. Abbreviation: TCGA: the cancer genome atlas program; KEGG: Kyoto Encyclopedia of Genes and Genomes.