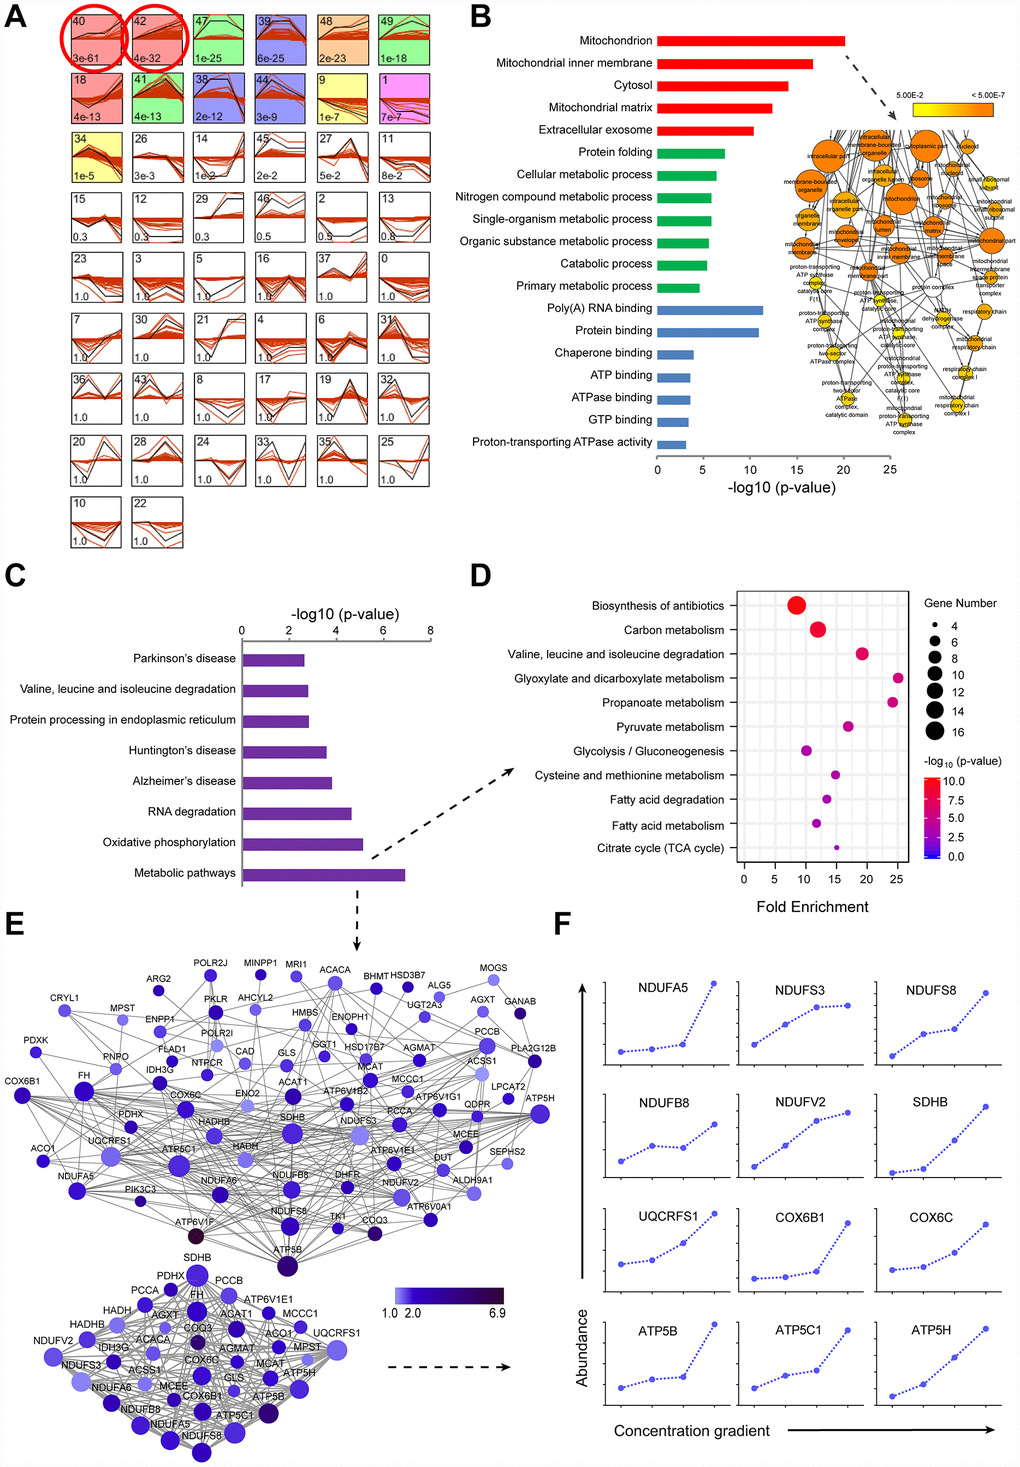
Figure 2.TMT-based proteomic analysis of expression of identified proteins in LI72h, MI72h and HI72h HepG2 cells. (A) Identification of clustered protein expression profiles by STEM. Model profiles (black) and the matched experimental protein expression profiles (red) are shown. Each box shows a profile identification number (upper left) and an unadjusted p value (lower left). Colored boxes represent model profiles assigned more proteins than expected by chance. (B) GO analysis of cellular components (red), biological process (green) and molecular function (blue) for 520 regulated proteins. 102 proteins involved in the term ‘mitochondrion’ were further analyzed by BiNGO plugin in Cytoscape. The node size corresponds to the number of proteins assigned to an individual term; p-value < 0.05 was defined as significant (yellow) and a darker color represents a lower p-value. See also supplementary Figure 2A and Table 2. (C) KEGG pathway analysis of 520 regulated proteins. (D, E) The proteins in the metabolic pathways were analyzed by the KEGG pathway (D, bubble chart) and the protein-protein interaction network (E). The extracted small network displays apparent interrelations between 33 mitochondrial proteins (lower panel, E). Each node is representative of a protein in the networks. The size of the nodes indicates the node degree that reflects the number of neighbors linked to a node. The color intensity corresponds to the fold change of proteins regulated in HI72h cells compared to that in the control. (F) Quantified profiles of regulated proteins associated with mitochondrial oxidative phosphorylation in the control, LI72h, MI72h and HI72h HepG2 cells. See also Supplementary Table 3.
Figure 2 — Mitochondrial metabolic study guided by proteomics analysis in hepatocellular carcinoma cells surviving long-term incubation with the highest dose of sorafenib | Aging