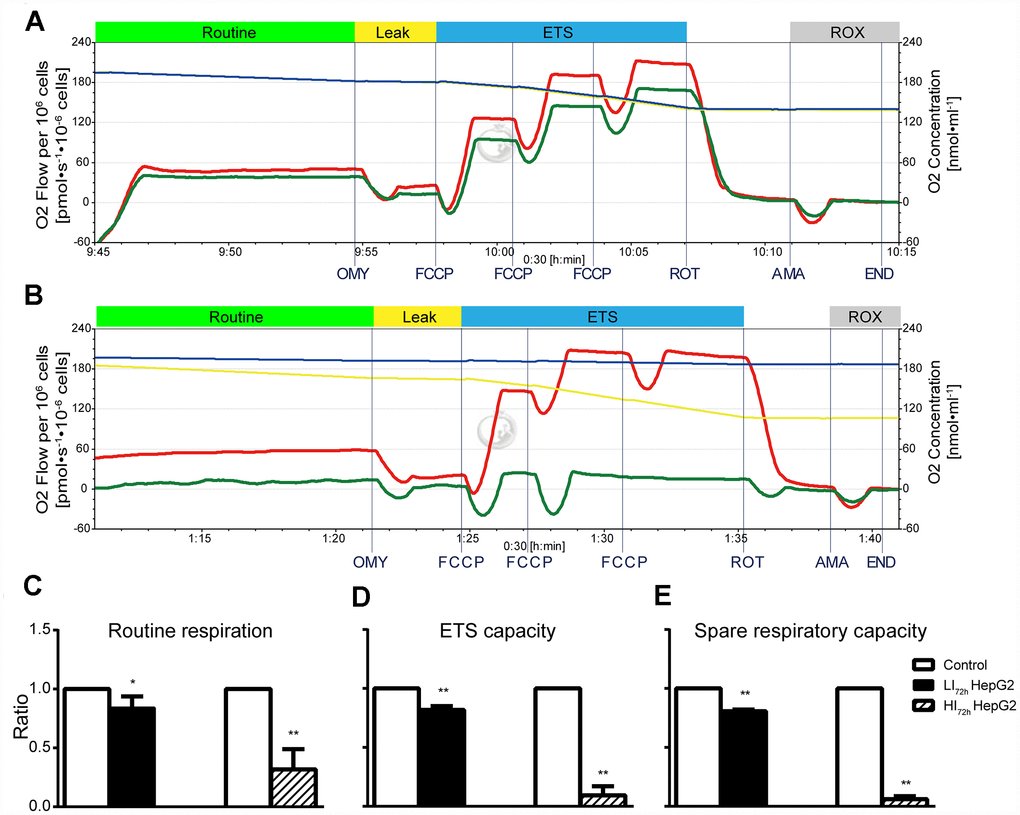
Figure 5.Changes in cellular mitochondrial respiratory function of LI72h and HI72h HepG2 cells. (A, B) Representative tracings of high-resolution respirometry in LI72h (A) and HI72h HepG2 cells (B) compared to the control cells, respectively. O2 flow per 106 cells (left axis; green line for LI72h or HI72h cells and red line for control cells) and O2 concentration (right axis; blue line for LI72h or HI72h cells and yellow line for control cells) were recorded in real time. OMY, oligomycin; FCCP, carbonylcyanide-4-(trifluoromethoxy)-phenylhydrazon; ROT, rotenone; AMA, antimycin A. (C–E) The results of routine respiration (C), ETS capacity (D) and spare respiratory capacity (E) in LI72h and HI72h HepG2 cells. The results are presented as the mean ± SD; *p < 0.05, **p < 0.01 by unpaired, two-tailed Student’s t test. Experiments were repeated 3 times.