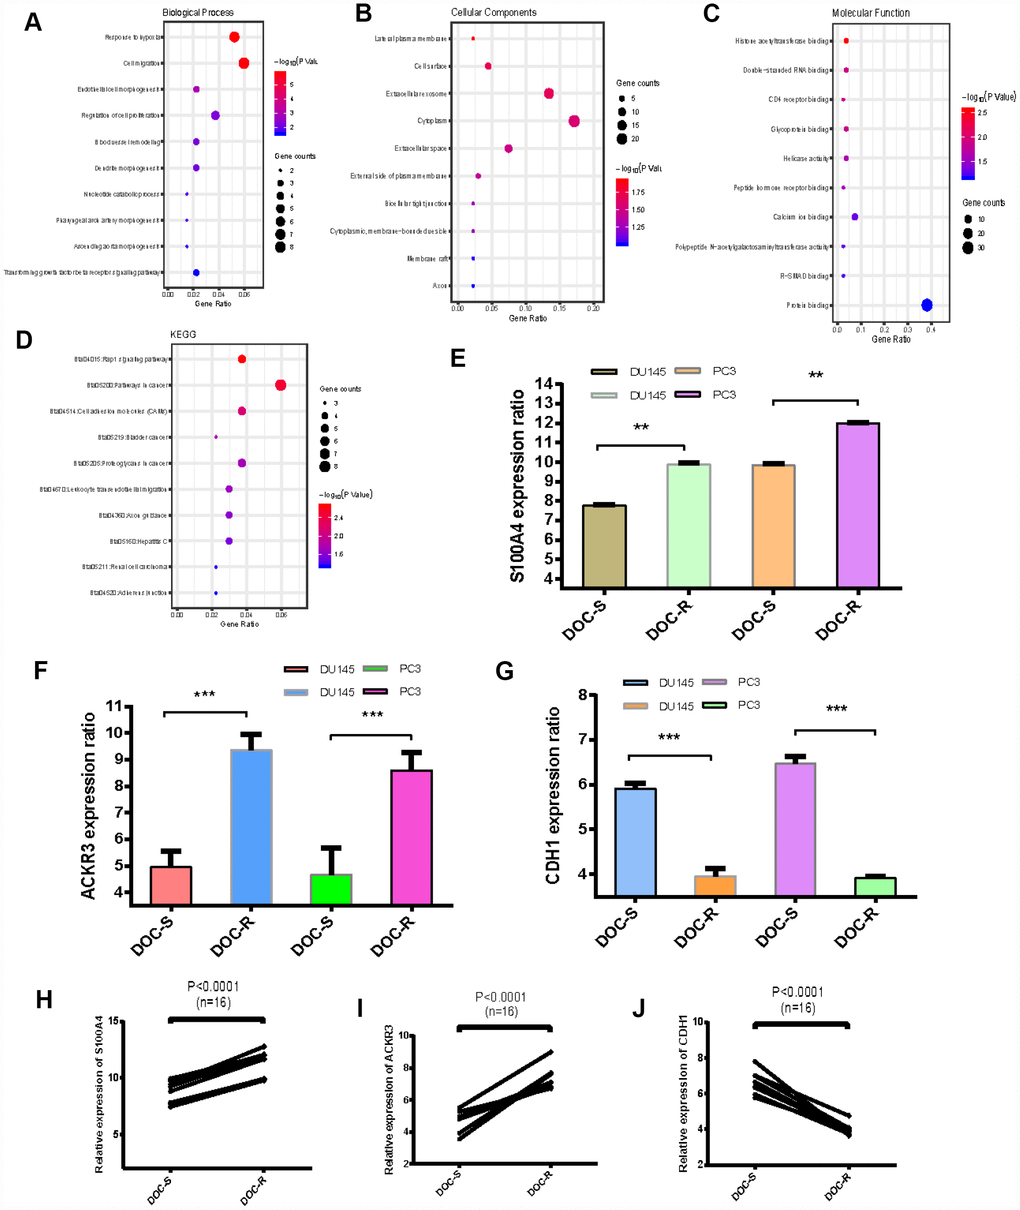
Figure 2.GO and KEGG analysis of overlapping DEGs, expression levels of three critical genes. (A–C) GO analyses. Shown are the top 10 biological processes (A), cellular components (B), and molecular functions (C). (D) KEGG pathway analysis. (E–G) Expression levels of S100A4, ACKR3 and CDH1 in Doc-resistant PCa cells (DOC-R) and Doc-sensitive controls (DOC-S). (H–J) Comparison of gene expression levels between Doc-resistant and Doc-sensitive cells. *P < 0.05, **P <0.01, ***P < 0.001.