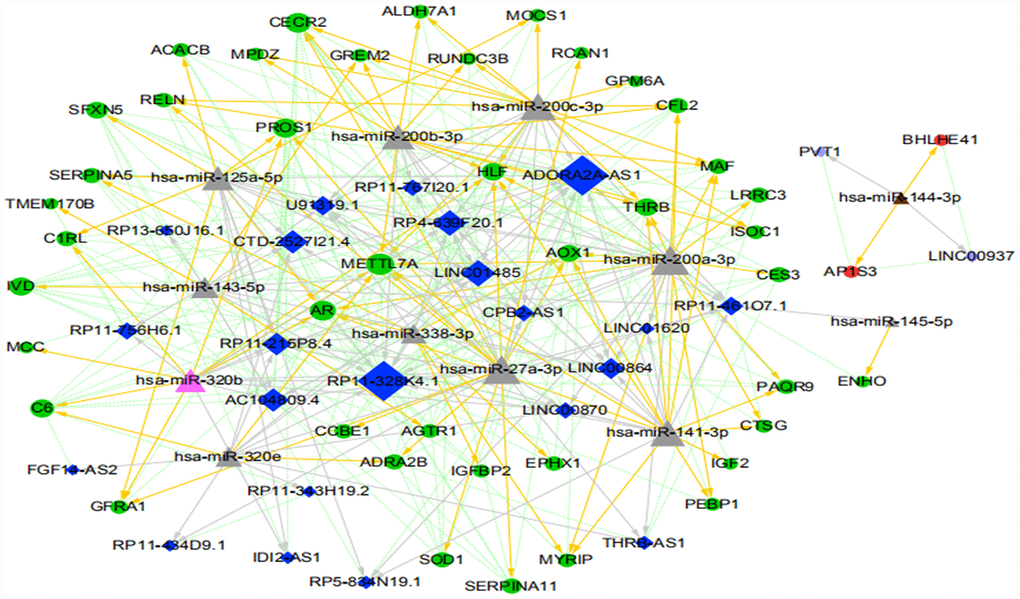
Figure 10.The ICC-related ceRNA network map (green circles indicate the downregulated mRNAs, red circles indicate the upregulated mRNA, dark blue diamonds indicate the downregulated lncRNA, light purple diamonds indicate the upregulated lncRNA, pink triangles indicate the upregulated miRNA, brown triangles indicate the downregulated miRNA, and gray triangles indicate that upregulation or downregulation of miRNAs cannot be determined. The gray arrow indicates the regulatory relationship between miRNA and lncRNA, the yellow arrow indicates the regulatory relationship between miRNA and mRNA, and the green dotted line indicates the synergistic expression relationship between lncRNA and mRNA).