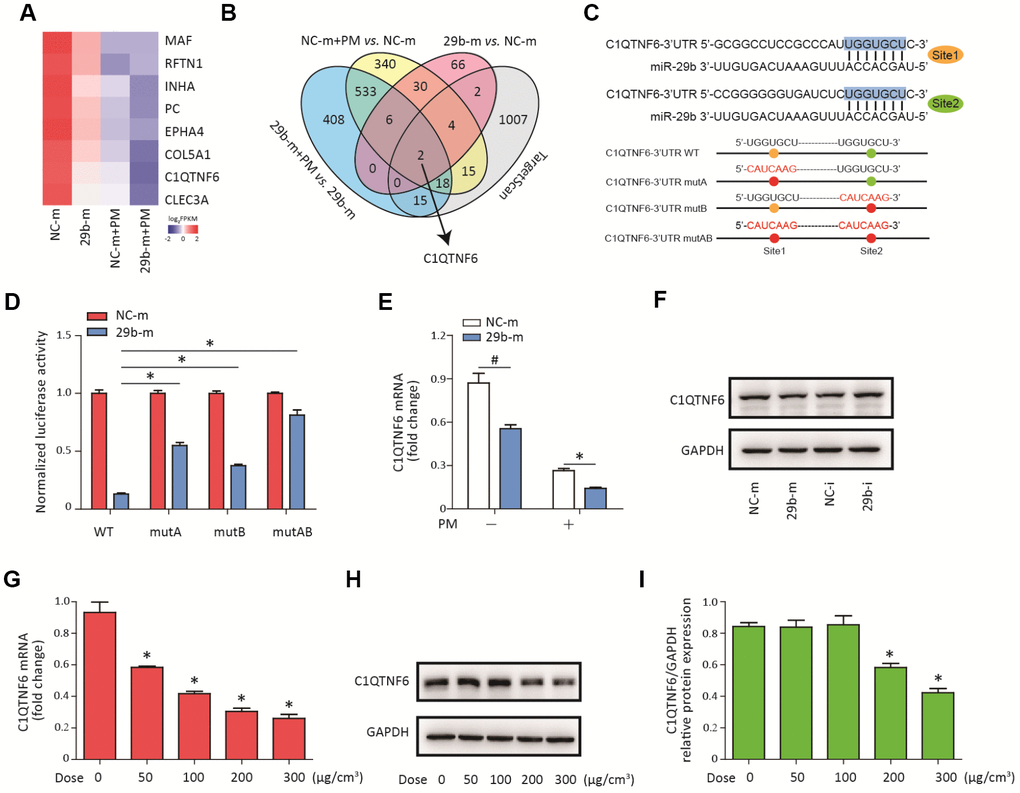
Figure 3.C1QTNF6 is the target gene of miR-29b-3p. (A) HBECs were transfected with miR-29b-3p mimic (29b-m) or negative control mimic (NC-m), respectively, and then treated with or without 300 μg/cm3 PM for 24 h. RNA sequencing identified the differentially-expressed genes in HBECs in the four groups (NC-m, 29b-m, NC-m + PM, and 29b-m + PM). The heatmap identified eight differentially downregulated genes common to the NC-m vs. 29b-m groups, NC-m + PM vs. 29b-m + PM groups, and NC-m vs. NC-m + PM groups. (B) Venn diagram showed the common differentially-downregulated genes in RNA sequencing and TargetScan analysis. (C) The binding sites between miR-29b-3p and the 3'UTR of C1QTNF6 were predicted by TargetScan. The aligned sequences of the 3'UTR of C1QTNF6 complementary to the seed sequence of miR-29b-3p and mutant sequences were shown. (D) HBECs were transfected with C1QTNF6-3'-UTR-WT, C1QTNF6-3'-UTR-mutA, C1QTNF6-3'-UTR-mutB or C1QTNF6-3'-UTR-mutAB plasmids combined with 29b-m or NC-m, respectively. The normalized luciferase activities were determined by luciferase reporter assay. Values represent mean ± SEM; *, P<0.05, compared with the WT plasmid + 29b-m group; n=6. (E) Real-time PCR analysis of C1QTNF6 expression in HBECs transfected with 29b-m or NC-m prior to PM exposure. Values represent mean ± SEM; *, P<0.05, compared with the NC-m + PM group; #, P<0.05, compared with the NC-m group; n=3. (F) Western blot analysis of C1QTNF6 expression in HBECs transfected with 29b-m, NC-m, miR-29b-3p inhibitor (29b-i), or negative control inhibitor (NC-i), respectively. (G) HBECs were stimulated with different doses of PM (50, 100, 200, and 300 μg/cm3) for 24 h and the mRNA expression of C1QTNF6 was detected using real-time PCR. (H) The protein expression of C1QTNF6 was detected using western blot analysis. The optical densities of protein bands were shown in (I). Values represent mean ± SEM; *, P<0.05, compared with the control group; n=3. HBECs, human bronchial epithelial cells; PM, particulate matter.