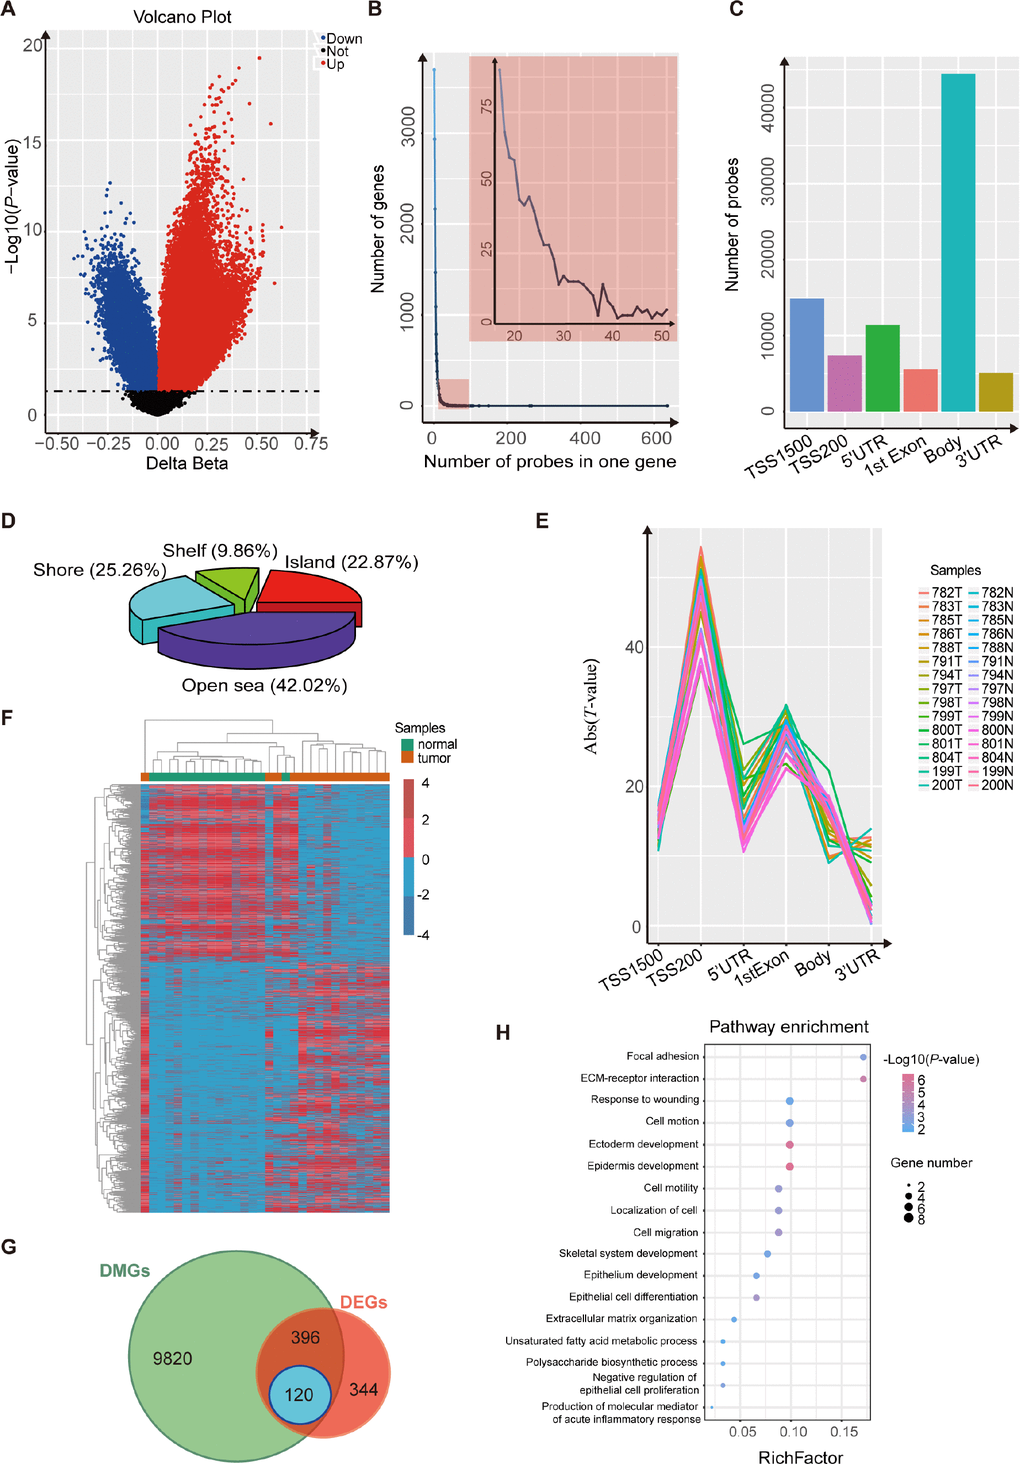
Figure 1.Analysis using the Illumina 450K bead array and RNA-Seq data for 15 paired ESCC samples. (A) Volcano plot representing the probes for differentially-methylated genes. The probes for hypermethylated genes are shown in red while probes for hypomethylated genes are shown in blue (P< 0.05). (B) Frequency line graph shows the coverage rate of differentially-methylated regions (DMPs) in one gene. The results show that most genes have more than twenty DMPs. (C) Distribution of differentially-methylated sites in six gene regions (TSS1500, TSS200, 5’ UTR, 1st exon, gene body and 3’ UTR). (D) Proportions of differentially-methylated regions from genes with associated CpG islands (CGI). (E) Plot of the regression t-statistics between log-normalized RNA-Seq RPKM values and corresponding average DNA methylation β values for probes, stratified according to six genetic regions. The number of curves equals the number of samples. (F) Heatmap shows the differentially-methylated genes in 15 paired ESCC samples. (G) Venn plot shows the overlap between differentially-methylated genes and differentially-expressed genes in 15 paired ESCC samples. (H) KEGG and GO analysis of 120 candidate genes that are both differentially methylated and differentially expressed.