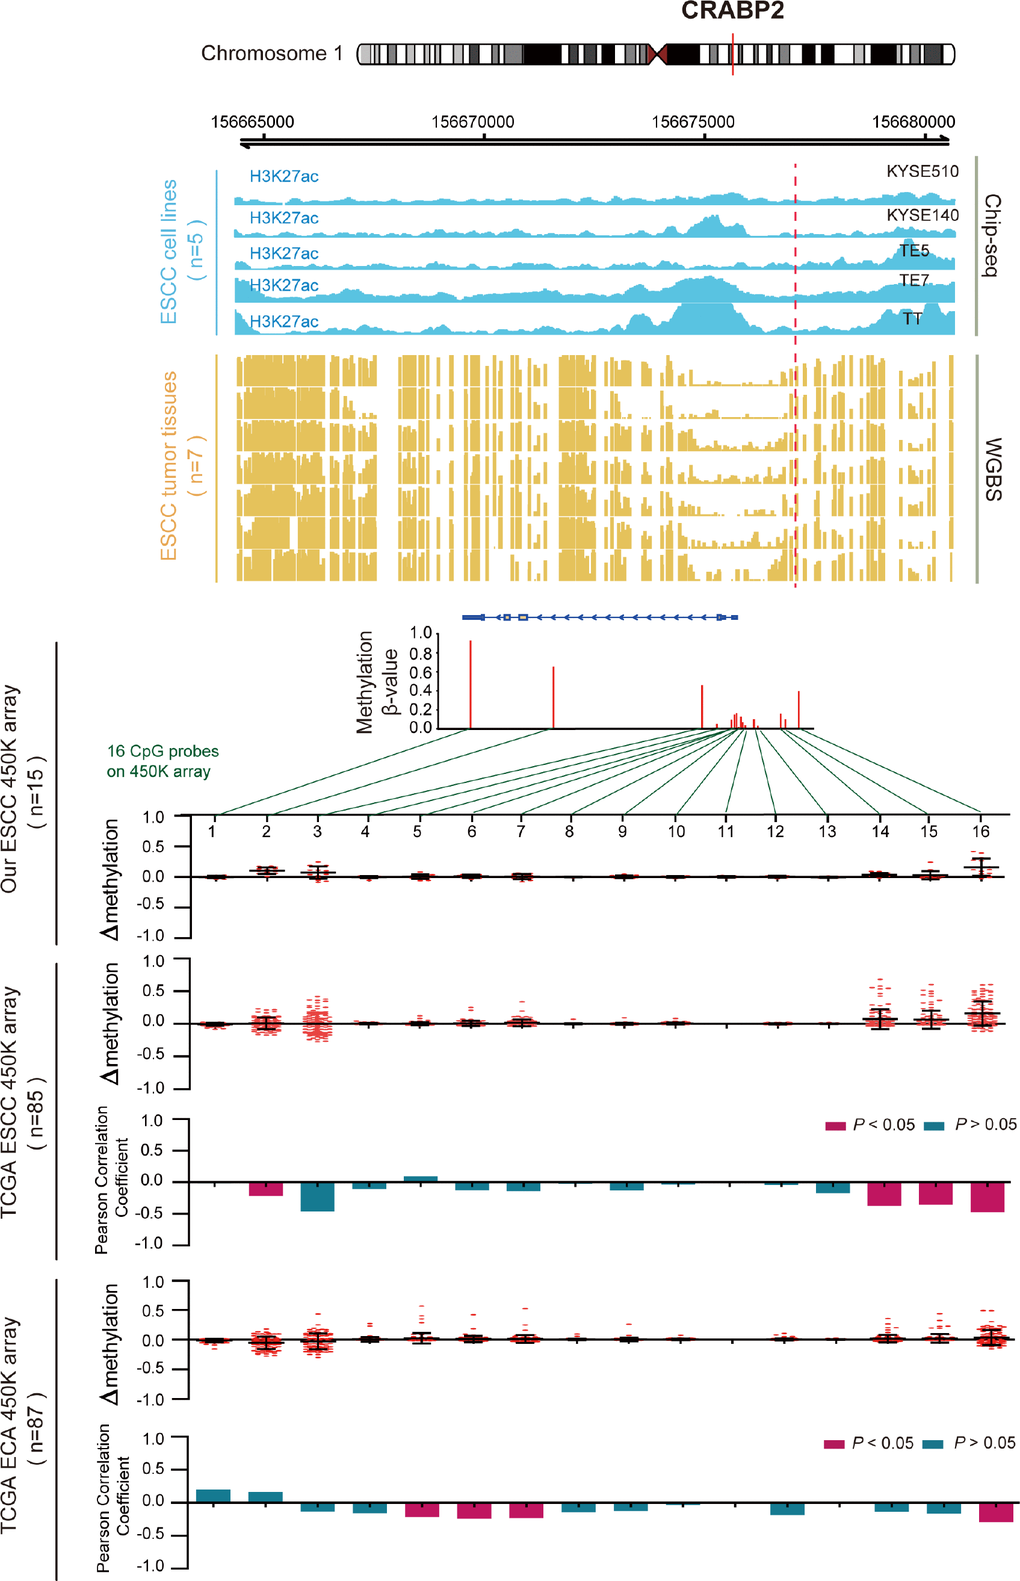
Figure 5.Inverse trend between DNA methylation and histone modification of CRABP2 in ESCC. Blue tracks represent the histone modifications in CRABP2 for five ESCC cell lines, and yellow tracks represent its methylation level, as measured by the WGBS assay. All tracks are on the same scale (0-1). Scatter diagrams show the Δβ of CRABP2 in ESCC samples compared with normal samples. Histograms show the correlation between DNA methylation and gene expression of CRABP2.