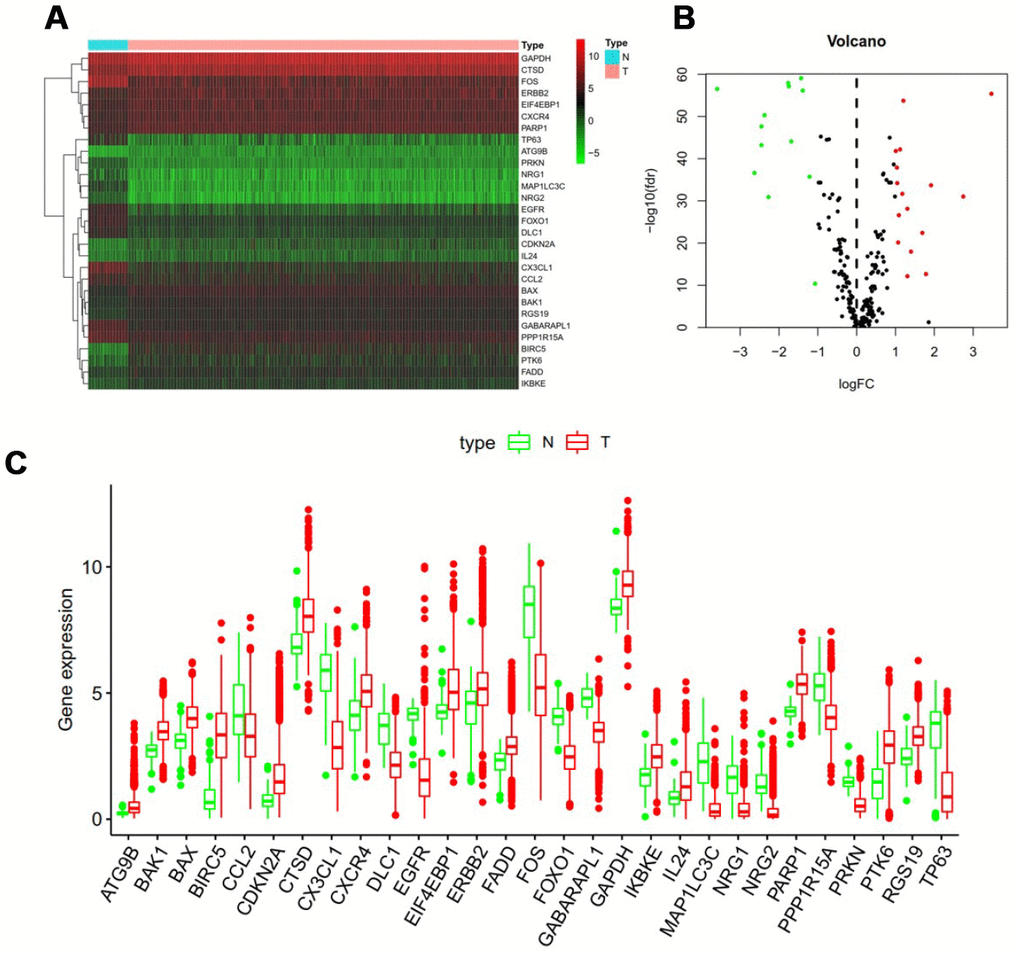
Figure 1.Differentially expressed autophagy-related genes. Heat map (A) and volcano map (B) show differentially expressed genes between breast cancer and normal tissues, with red dots representing significantly up-regulated genes, green dots representing significantly down-regulated genes, and black dots representing no differences gene. (C) Expression patterns of 29 autophagy-related genes (ARGs) in breast cancer types and paired non-tumor samples. Each red box plot represents a different tumor sample and blue represents a non-tumor sample.