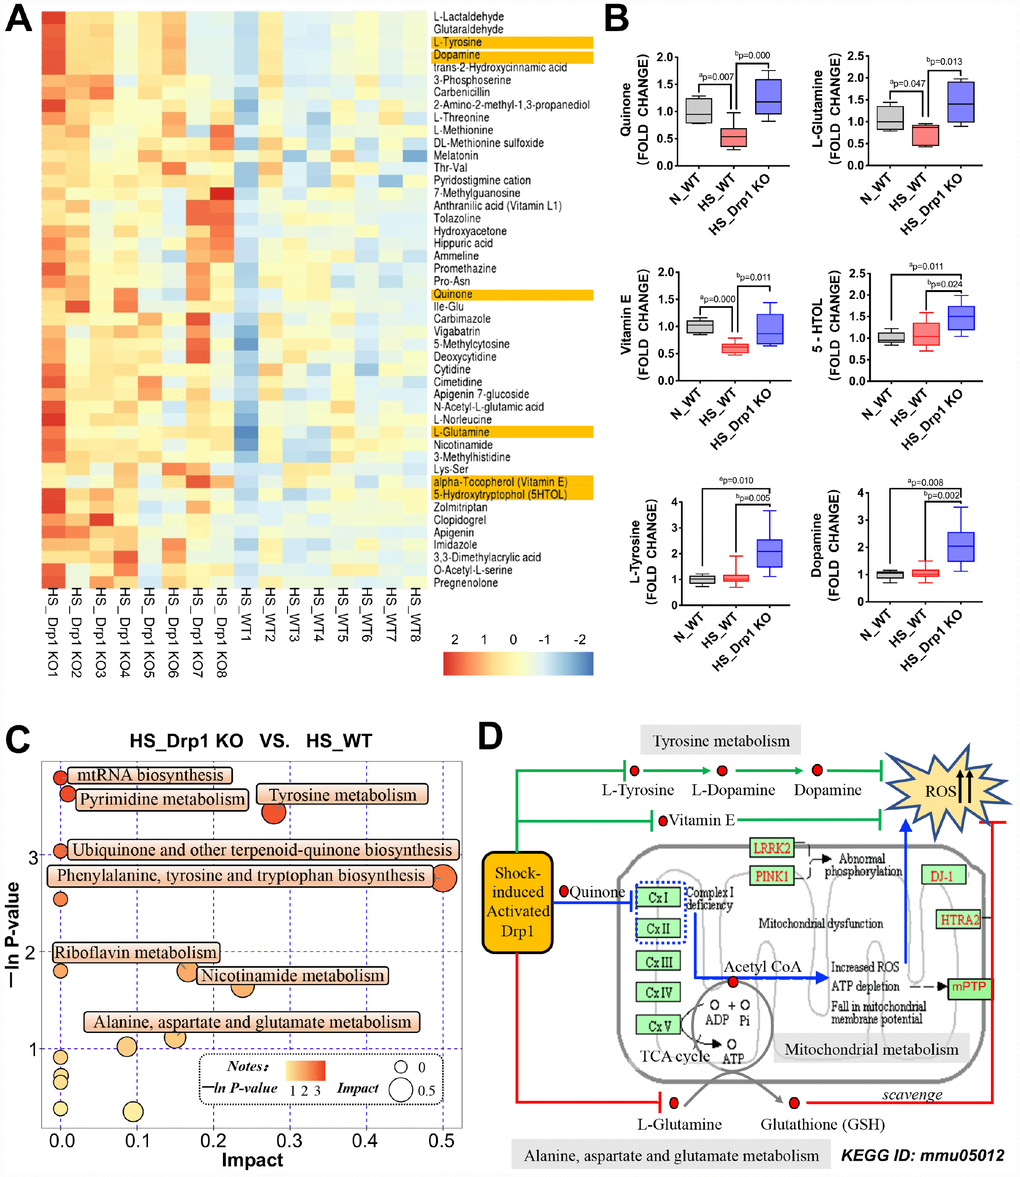
Figure 5.The effects of Drp1 on mitochondrial metabolism after shock. (A) Heatmap of differentially-expressed metabolites affected by Drp1 in colon tissues. Our concerned differential metabolites are labeled in yellow (8 mice/ group). (B) The fold change values of our concerned metabolites detected by metabolomics mass spectrometry (8 mice/ group). (C) The bubble map of differentially-expressed metabolic pathways affected by Drp1 in colon tissues. Each bubble represents a metabolic pathway. The abscissa and the size of bubbles indicate the impact of pathways. The bigger the bubble size is, the bigger the impact is. The ordinate and the color of bubbles indicate the P value of enrichment analysis (Expressed in the form of -ln P-value). The deeper the bubble color is, the smaller the P value is. (D) KEGG pathway annotation of differential metabolites and pathways affected by Drp1 after shock. The annotation is edited based on KEGG ID: mmu05012. N_WT, WT mice in normal condition; HS_WT, WT mice in hemorrhagic shock condition; HS_Drp1 KO, Drp1 KO mice in hemorrhagic shock condition. a represents p < 0.05 compared with N_WT group; b represents p < 0.05 compared with HS_WT group.