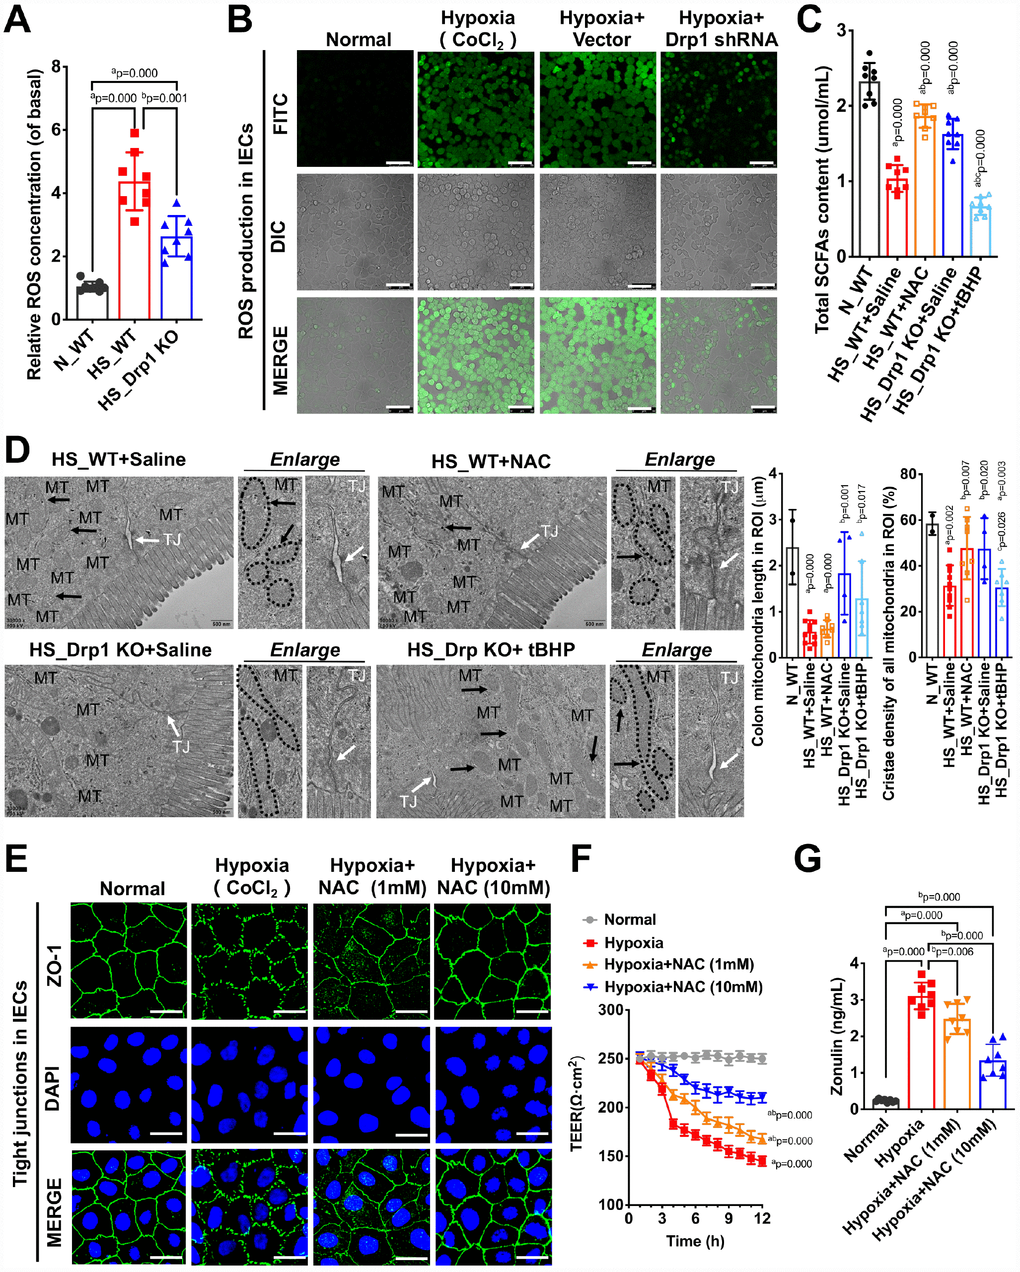
Figure 6.Drp1-induced ROS accumulation is involved in the regulation of gut microbiome composition and intestinal barrier function after shock or hypoxia. (A) Relative ROS concentration in colon tissues of each group (8 mice/ group). (B) The ROS fluorescence intensity of hypoxia-treated IECs after Drp1 shRNA (Bar, 50μm) (C) The content of total SCFAs after ROS intervention (8 mice/ group). (D) Mitochondrial morphology and tight junction of IECs after ROS intervention observed by electron microscopy. MT, mitochondria (black arrows refer to vacuolated cristae structure); TJ, tight junctions (white arrows). The boundaries of mitochondria are depicted and the lengths as well as cristae density of all mitochondria in ROI (region of interest) are calculated by Image J software. The mitochondrial number in ROI: 2 in N_WT group, 10 in HS_WT+ Saline group,8 in HS_ WT+ NAC group, 4 in HS_ Drp1 KO+ Saline group, 7 in HS_ Drp1 KO+ tBHP group. (Bar, 500nm). (E) Tight junctions (ZO1) of IECs after ROS intervention detected by immunofluorescence. (Bar, 50μm). (F) The TEER value of monolayer IECs after ROS intervention. The observation time lasts 12 hours and measures every 1 hour (n=5). (G) The Zonulin content in supernatant of IECs after ROS intervention (n=8). N_WT, WT mice in normal condition; HS_WT, WT mice in hemorrhagic shock condition; HS_Drp1 KO, Drp1 KO mice in hemorrhagic shock condition; NAC, N-acetylcysteine; tBHP, tert-Butyl Hydroperoxide. a represents p < 0.05 compared with N_WT or Normal group; b represents p < 0.05 compared with HS_WT, HS_WT+ Saline or Hypoxia group; c represents p < 0.05 compared with HS_Drp1 KO+ Saline group.