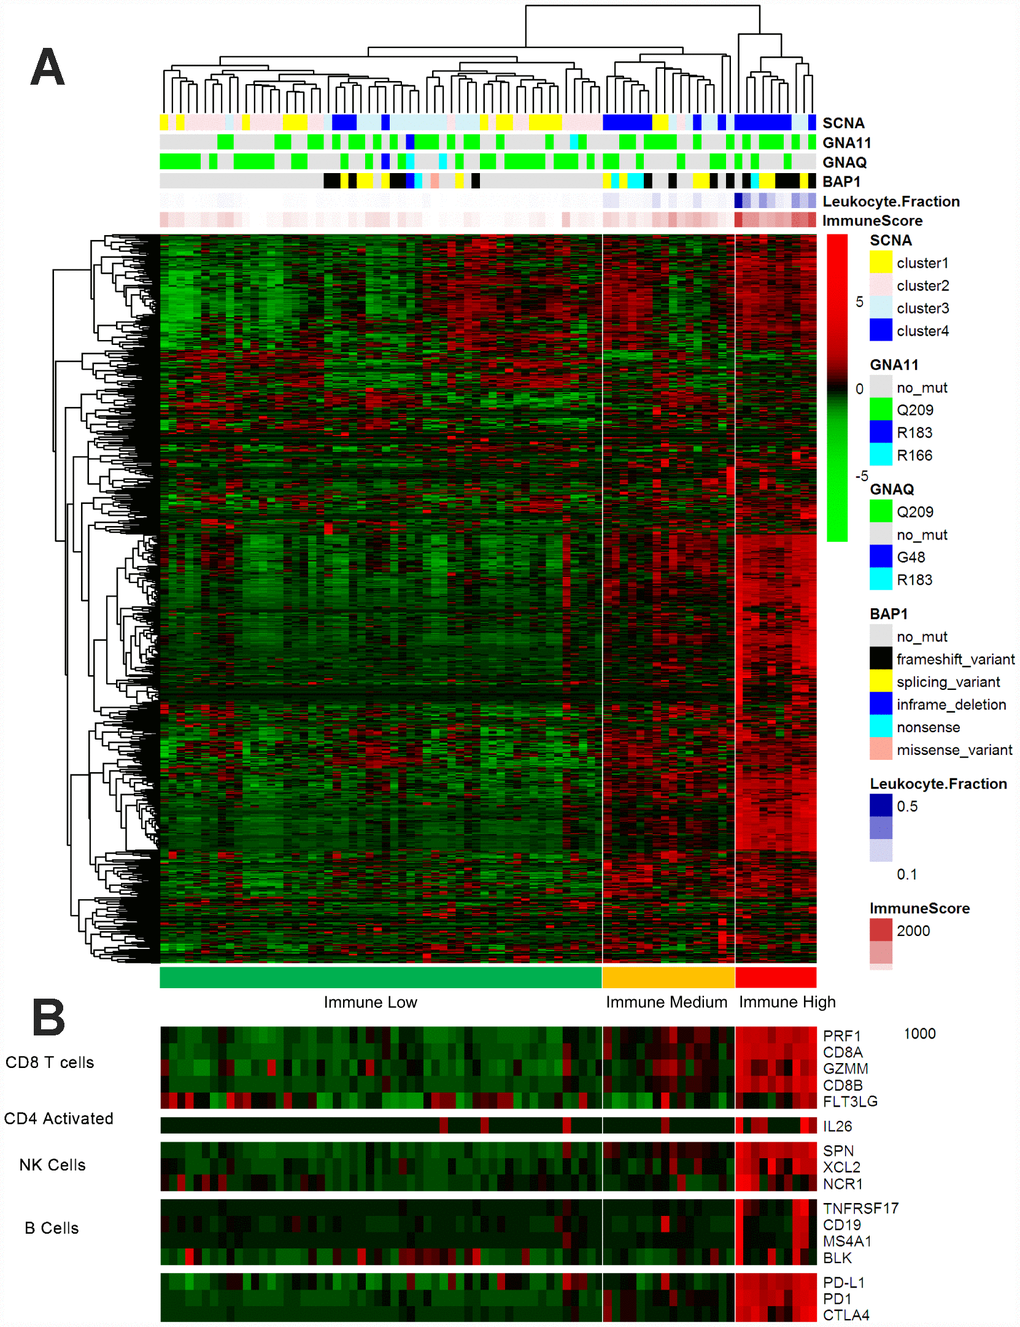
Figure 2.Immune-related gene expression in the UM dataset of TCGA. (A) Hierarchical clustering of 80 tumors based on 730 immune-related genes. Genes were median-centered. Each colored square represents the relative mean transcript abundance (log2 FPKM+1) for each sample, with the lowest levels shown in green, the median levels in black and the highest levels in red. The genetic mutation type, SCNA type, immune score, leukocyte fraction and BAP1 mutation status are shown below the array tree. (B) The expression of selected gene signatures or genes is demonstrated below the heatmap.