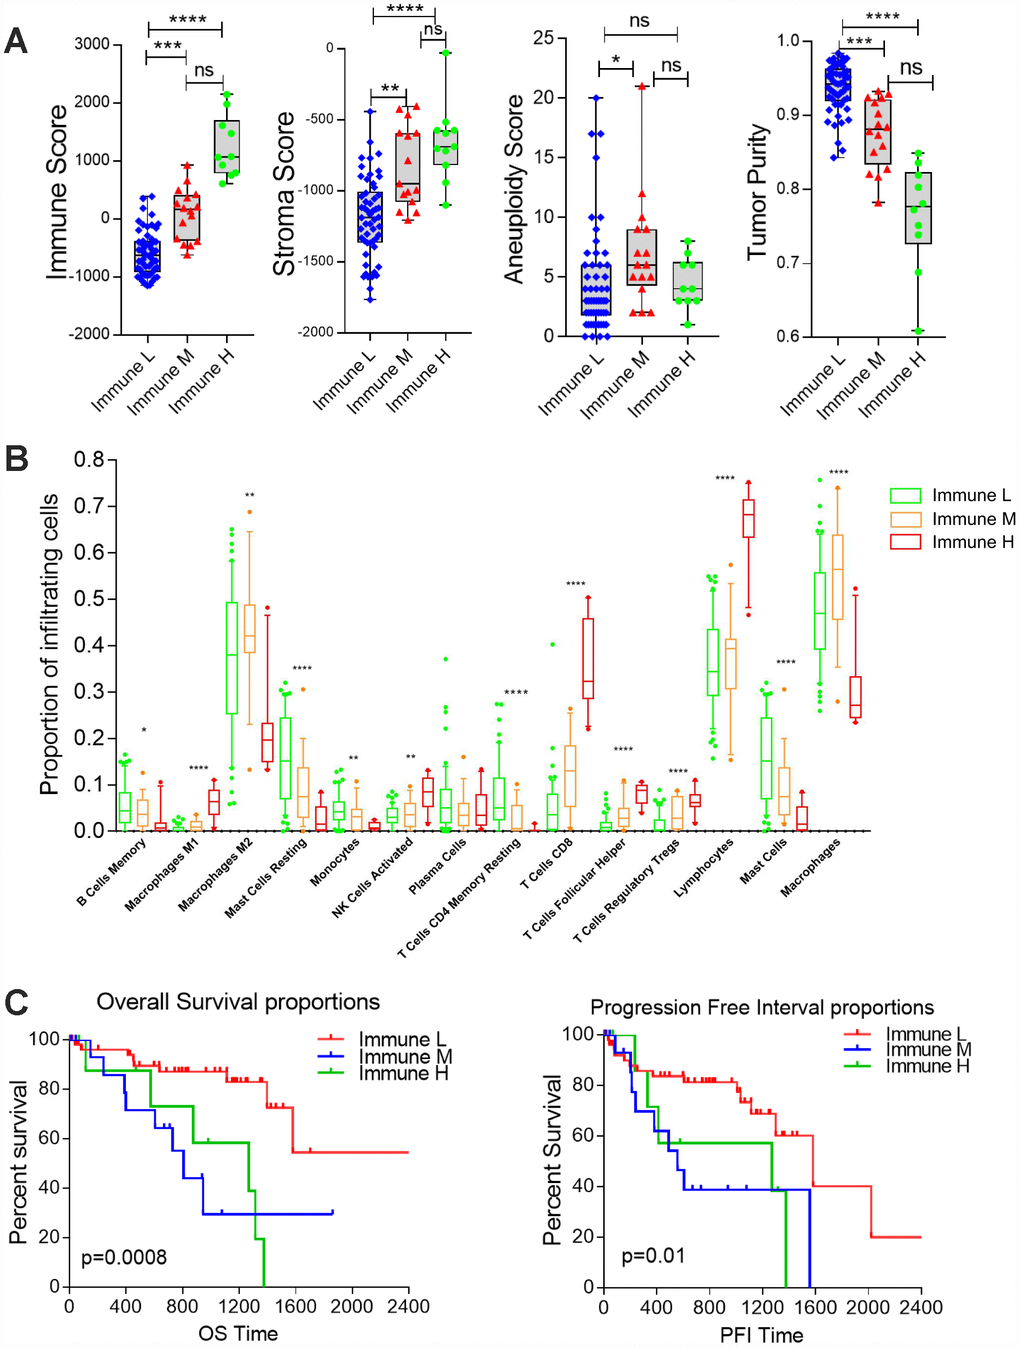
Figure 3.Differential infiltration of the immune subgroups. (A) Box plots comparing the distribution of immune infiltration measures in the three immune subtypes. Each box spans the interquartile range, with the lines representing the median for each group. Whiskers represent the absolute range. All outliers are included in the plot. (B) Differential proportions of immune cells in the immune subtypes. (C) Kaplan-Meier survival curves demonstrate that the Immune M and H groups of UM patients consistently exhibited worse OS and PFIs than the Immune L group (log-rank test, P<0.05).