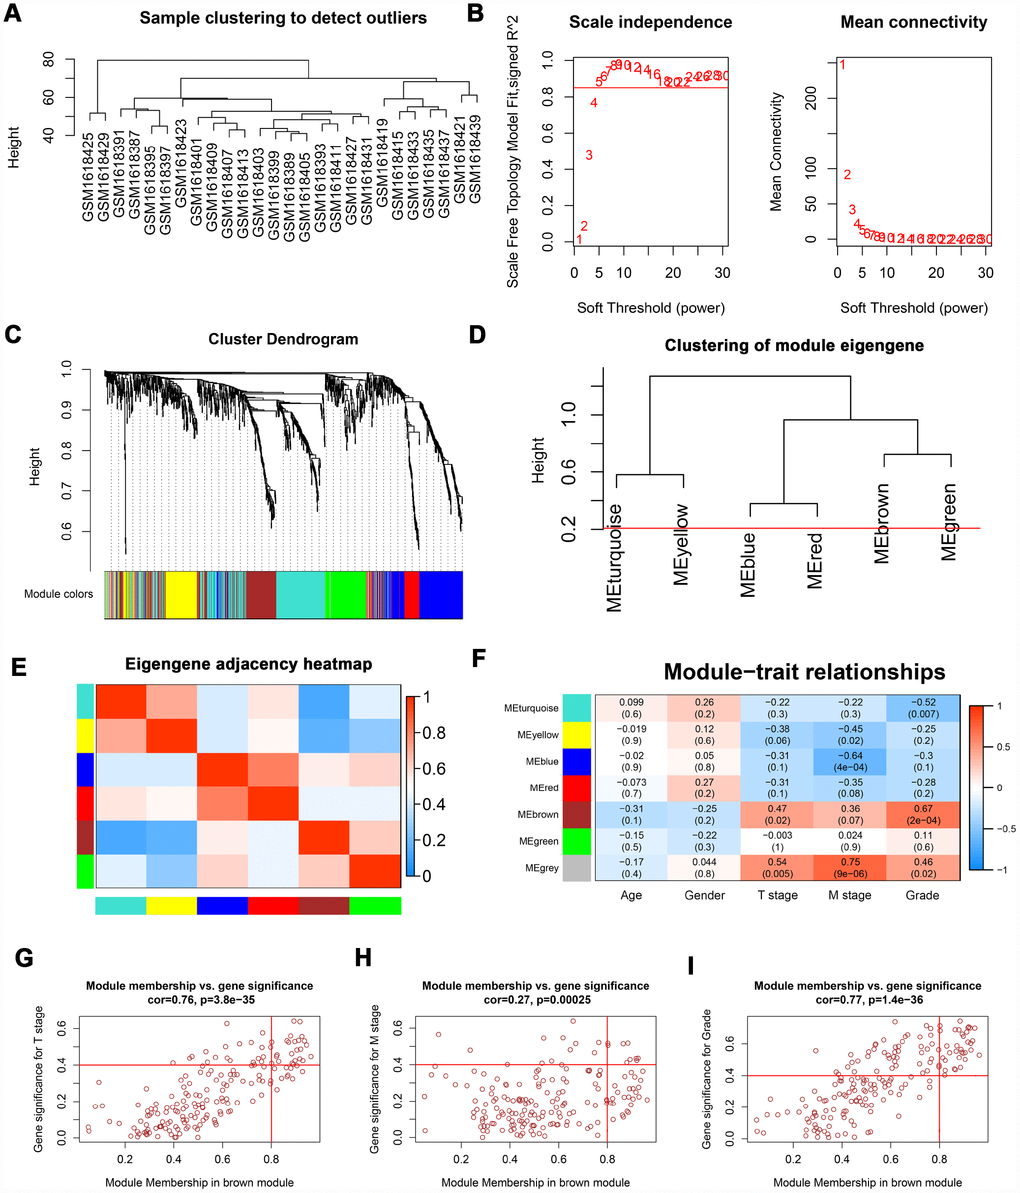
Figure 2.WGCNA of DEGs. (A) Sample clustering of GSE66272 to detect outliers. (B) Analysis of scale-free fit parameter and mean connectivity for various soft-thresholding power. (C) Dendrogram of DEGs clustered based on a dissimilarity measure (1-TOM). The DEGs were divided into seven modules (turquoise, yellow, blue, red, brown, green and grey module). (D, E) Clustering of module eigengene and eigengene adjacency heatmap to calculate the correlation between each module. No modules need to be merged. (F) The brown module was selected as the most important module according to the correlation between MEs and clinical traits. (G–I) Nine genes (TOP2A, NUF2, KIF4A, HJURP, FOXM1, CDCA8, CDCA5, CDC45, and ISG20) were identified as key genes in the brown module due to significantly associated with T stage, M stage, and Grade. WGCNA: weighted gene co-expression network analysis; DEGs: differentially expressed genes; TOM: topological overlap matrix; MEs: module eigengenes; MM: module membership; GS: gene significance.