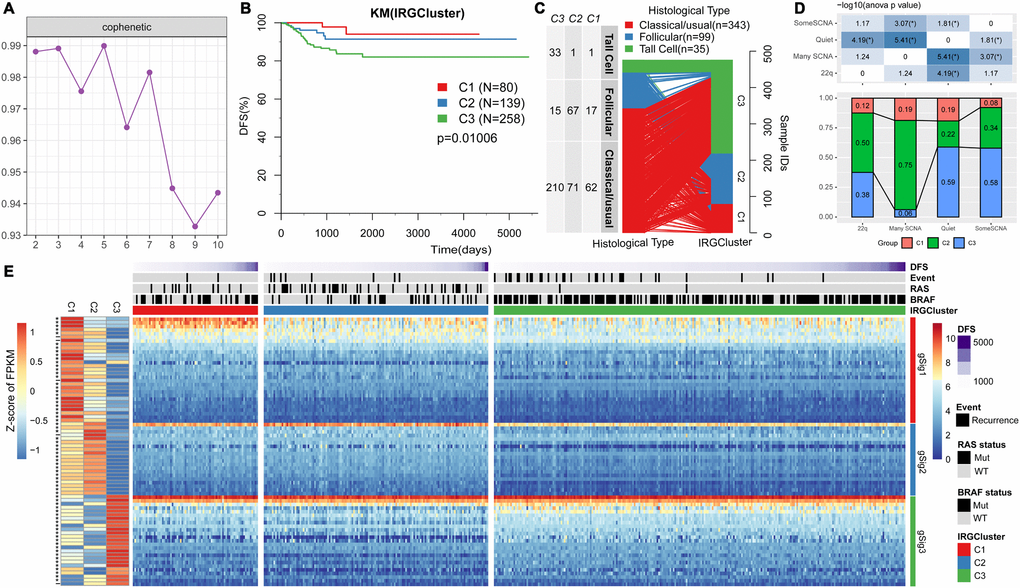
Figure 1.IRGs-based THCA immunophenotyping. (A) The interaction correlation coefficient (y-axis) is plotted against the number of subtypes (2-10; x-axis). Stability decreased between 3 and 4 subtypes, indicating that there are at least three molecular features in the expression profile of TCGA THCA IRGs. (B) KM curve showing the progression-free survival of each immunotype. (C) Comparison of pathological subtypes with IRGCluster. (D) Comparison of molecular subtypes with copy number variation and IRGCluster. The top panel is the heat map showing significant difference in the distribution of IRGCluster in the four subtypes with copy number variation. Bottom panel shows the distribution of IRGCluster in the four subtypes with copy number variation. (E) Heatmap showing THCA immunotypes and gene module gene expression, left panel is 74 genes on IRGCluster average expression level, * indicates FDR <0.05.