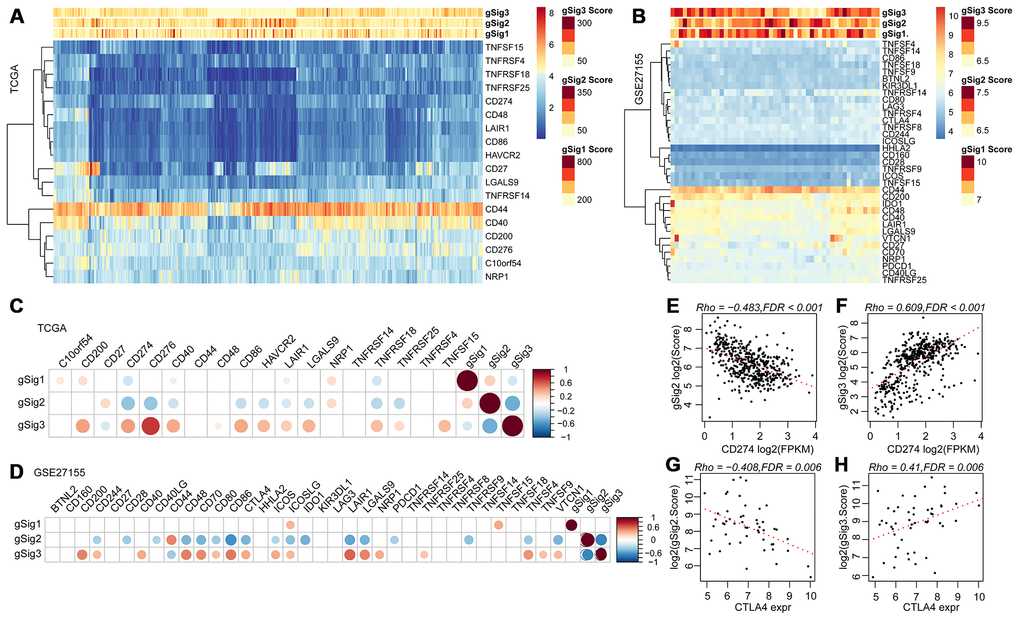
Figure 5.(A, B) Relationship between ICGs expression and gSig scores in the TCGA and GSE27155 data sets. (C, D) Correlation matrix of ICGs expression and gSig score in the TCGA and GSE27155 datasets. (E–F) Dot map showing CD274 gene expression, gSig2, and gSig3 in TCGA dataset. (G–H) Dot map showing GLA27155 gene expression, gSig2, and gSig3 in GSE27155 dataset. Correlation analysis used the spearman correlation coefficient.