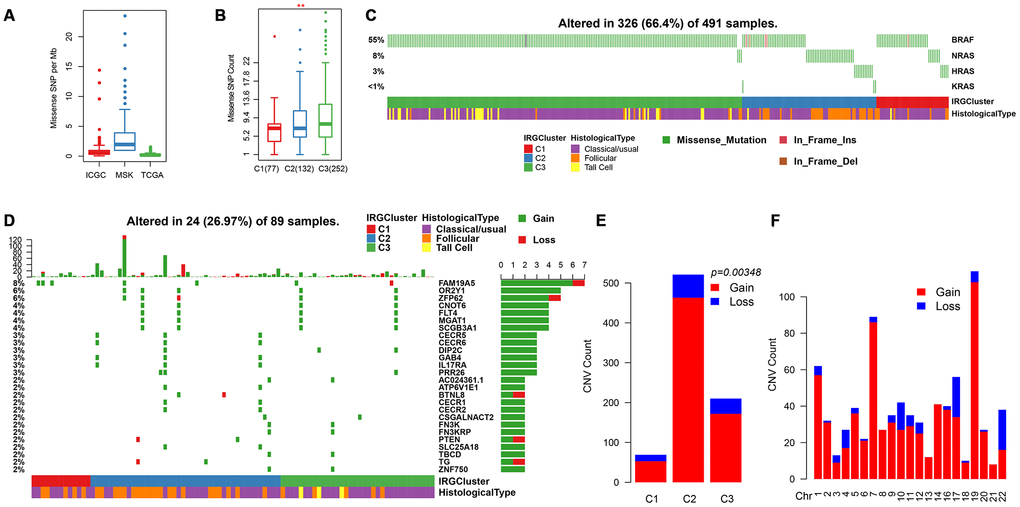
Figure 6.Genomic mutations in IRGCluster. (A) Quantity distribution of missense mutation (count per Mb) in ICGC, MSK and TCGA data sets. (B) Quantity distribution of mutations in IRGCluster sample. (C) BRAF and RAS gene mutations distribution. (D) CNV distribution in the top 27 gene. (E) CNV distribution in the IRGCluster sample. (F) Genomic distribution of CNV. Considering the instability of the INDEL detection, only the missense type mutation site is selected here.