Submit an Article
Navigate
Home
Editorial Board
Editorial Policies
Current Volume
Archive
Scientific Integrity
Publication Ethics Statements
Interviews with Outstanding Authors
Newsroom
Sponsored Conferences
Podcast
Contact
Special Collections
Submit an Article
Online ISSN: 1945-4589
Research Paper
|
Volume 12, Issue 7
|
pp. 5792–5811
Decitabine in combination with low-dose cytarabine, aclarubicin and G-CSF tends to improve prognosis in elderly patients with high-risk AML
Back to article
Figure 2
(2 of 8)
−
100%
+
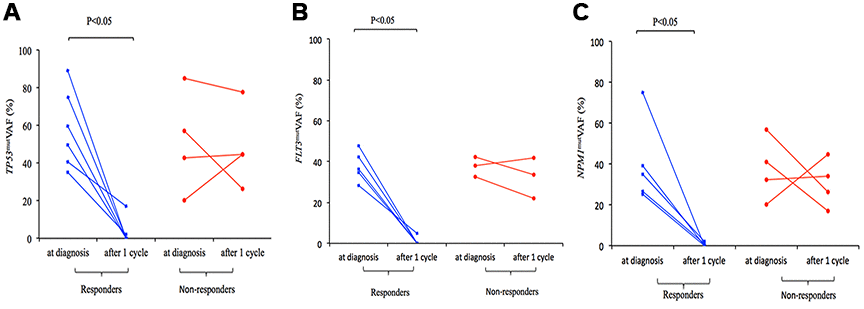
Figure 2.
Change in
TP53
mut
(
A
),
FLT3
mut
(
B
), and
NPM1
mut
(
C
) VAF in responders and non-responders to D-CAG with paired samples at diagnosis and after 1 cycle.