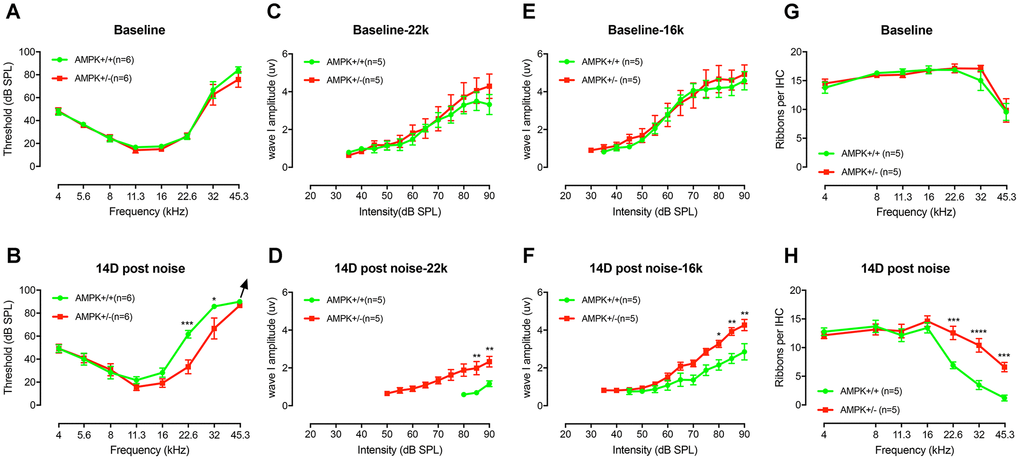
Figure 8.AMPK KO protects the noise-induced hearing loss and synaptopathy. (A) The baseline ABR thresholds for the two genotype groups were similar at the age of 1-2 months (F(1,10)=0.0095, p=0.3419). (B) An episode of two-hour, 106 dB SPL noise exposure induces significant threshold shifts at 22.6 kHz and 32 kHz 1 d after exposure (data not shown). Complete threshold recovery were found in AMPK+/− group at 14d (F(1,10)=3.455, p=0.0927) but not the WT (F(1,10)=15.22, p=0.0030). Significant difference in thresholds between both genotypes on D14 post-exposure (F(1,10)=5.776, p=0.0371), for 22.6 kHz (p=0.0001) and 32 kHz (p=0.0214), respectively. (C–F) ABR wave I amplitudes, evoked by suprathreshold tones at 16 (C) and 22.6 kHz (E), have no significant difference before noise exposure (for 16 kHz, F(1,8)=0.05484, p=0.8207 and for 22.6 kHz, F(1,8)=0.2944, p=0.6022). WT mice suffer more severe ABR wave I amplitude reduction at 16 (F) and 22.6 kHz (D) than AMPK KO mice 14 days after noise exposure (for 16 kHz, F(1,8)=17.85, p=0.0029 and for 22.6 kHz, F(1,8)=14.43, p=0.0052). 14 days after noise, the noise-induced decrease in wave I amplitudes in wild type group was significantly elevated at 22.6 kHz (from 3.32 ± 0.53 μV to 1.17 ± 0.15 μV) and at 16 kHz (from 4.58 ± 0.48 μV to 2.85 ± 0.43 μV), whereas in AMPK+/− group, the wave I amplitudes at 22.6 kHz (from 4.29 ± 0.64 μV to 2.33 ± 0.28 μV) and at 16 kHz (from 4.93 ± 0.50 μV to 4.27 ± 0.30 μV) had little change following acoustic trauma. (G) Numbers of CtBP2 in IHCs from both groups before noise exposure show no significant difference between the two genotype groups (F(1,8)=0.3357, p=0.5783). (H) At 14 days post-exposure, wild type mice suffer more loss of CtBP2 in the region of 22.6, 32, and 45.3 kHz than AMPK KO mice. (KO vs. WT, F(1,8)=13.24, p=0.0066; for 22.6 kHz, p=0.0004; for 32 kHz, p<0.0001 and for 45.3 kHz, p=0.0008). Two-way ANOVA followed by Bonferroni post-test was applied in the statistical analysis of the figure. n=5 or 6 for each group. Data presented as mean ± SEM; * P<0.05, ** P<0.01, ***P<0.001, **** P<0.0001.