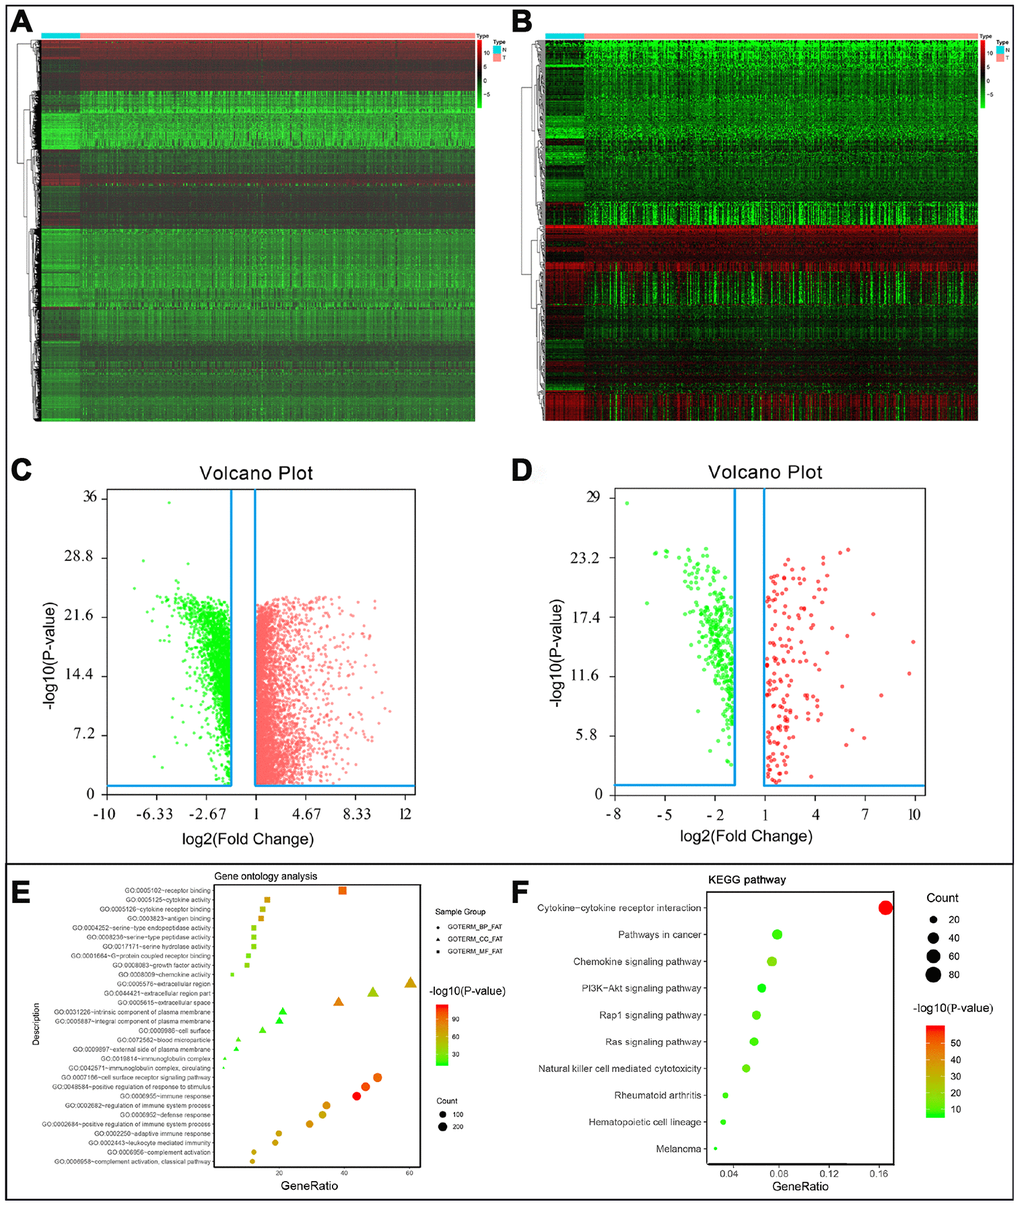
Figure 1.(A) Differentially expressed genes, with red representing high expression and green representing low expression. (B) Differentially expressed immune-related genes, with red representing high expression and green representing low expression. (C) Volcano plot of 6524 differentially expressed genes, with red representing up-regulated and green representing down-regulated. (D) Volcano plot of 484 differentially expressed immune-related genes, with red representing up-regulated and green representing down-regulated. (E) Gene ontology analysis of differentially immune-related genes, circle presentations biological process, triangle presentations cellular component, square presentations molecular function. (F) KEGG pathway analysis of differentially immune-related genes.