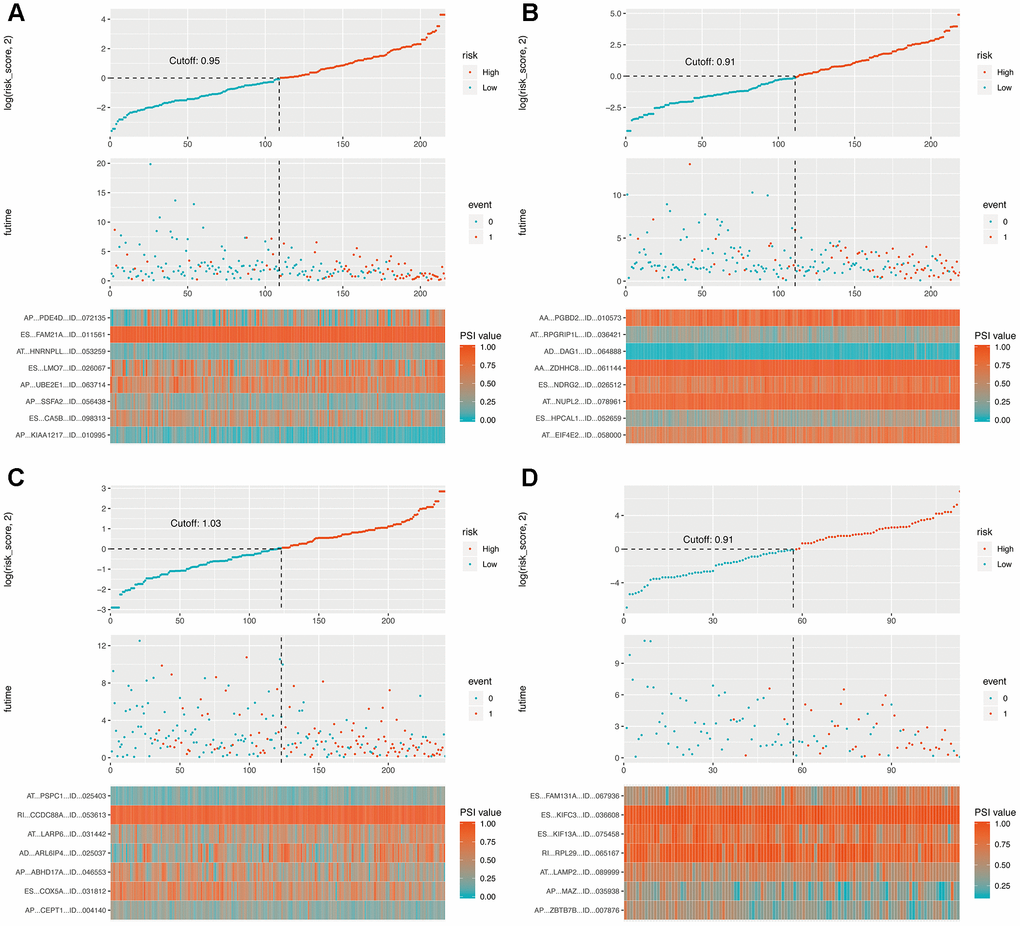
Figure 4.Determination and analysis of the final prognostic models in four cohorts. (A) LUAD_MALE group, (B) LUAD_FEMALE group, (C) LUSC_MALE group, (D) LUSC_FEMALE group. Patients were divided into high- and low-risk subgroups based on the median cut of risk score calculated separately. The upper part of each assembly indicates distribution of patients’ survival status and survival times ranked by risk score, the middle part represents the risk score curve, and the bottom heatmap displays splicing pattern of the AS from final prognostic models. Color transition from blue to red indicates the increasing PSI score of corresponding AS event from low to high.