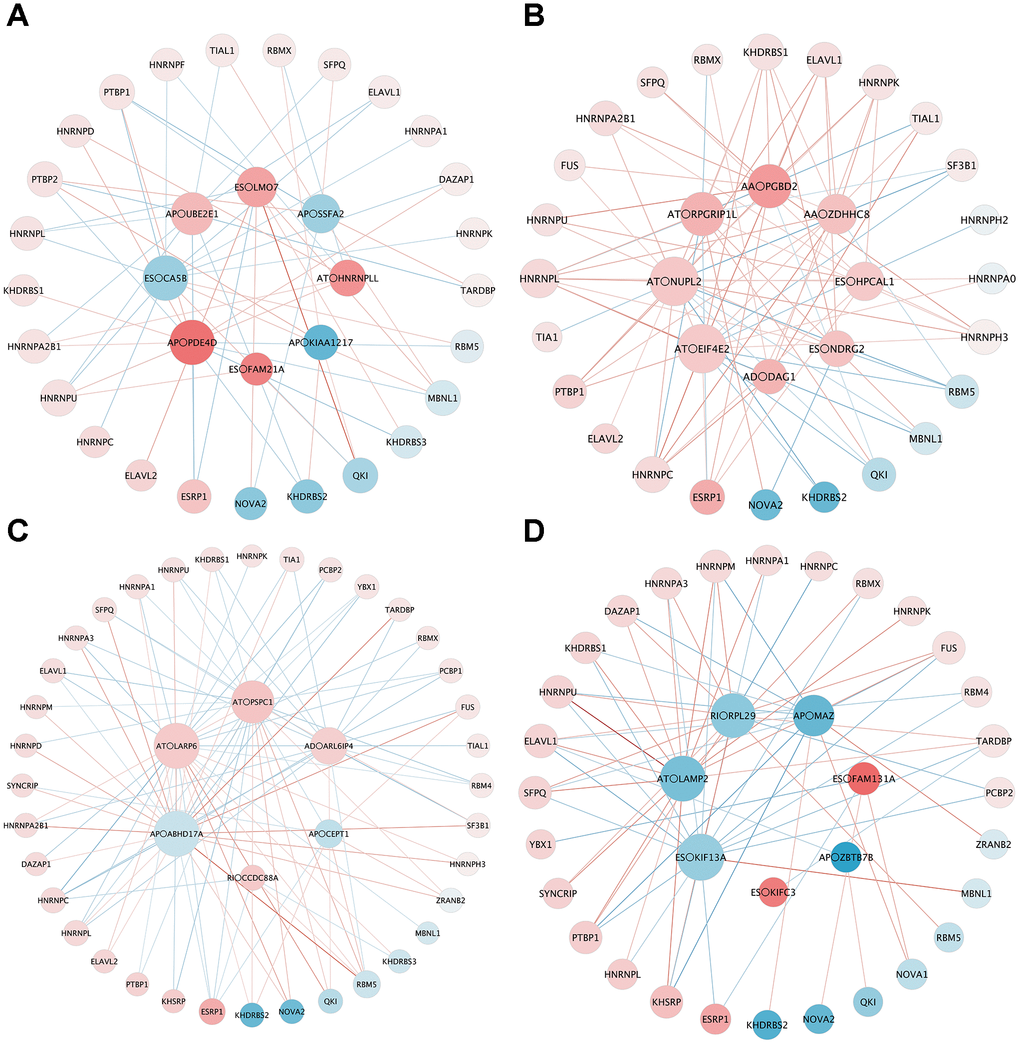
Figure 7.The correlation network of DESF and OS-related DEAS. (A) LUAD_MALE group, (B) LUAD_FEMALE group, (C) LUSC_MALE group, (D) LUSC_FEMALE group. The size indicates the degree of the point in the network, and the intensity of the color indicates the strength of its characteristics. For DESFs, the peripheral red dots indicate upregulation (log fold change (FC) > 1), while the blue dots indicate downregulation (logFC < 1). For DEAS events, the central red dots indicate poor prognosis (hazard ratio (HR) > 1), while the blue dots indicate better clinical outcomes (HR < 1).